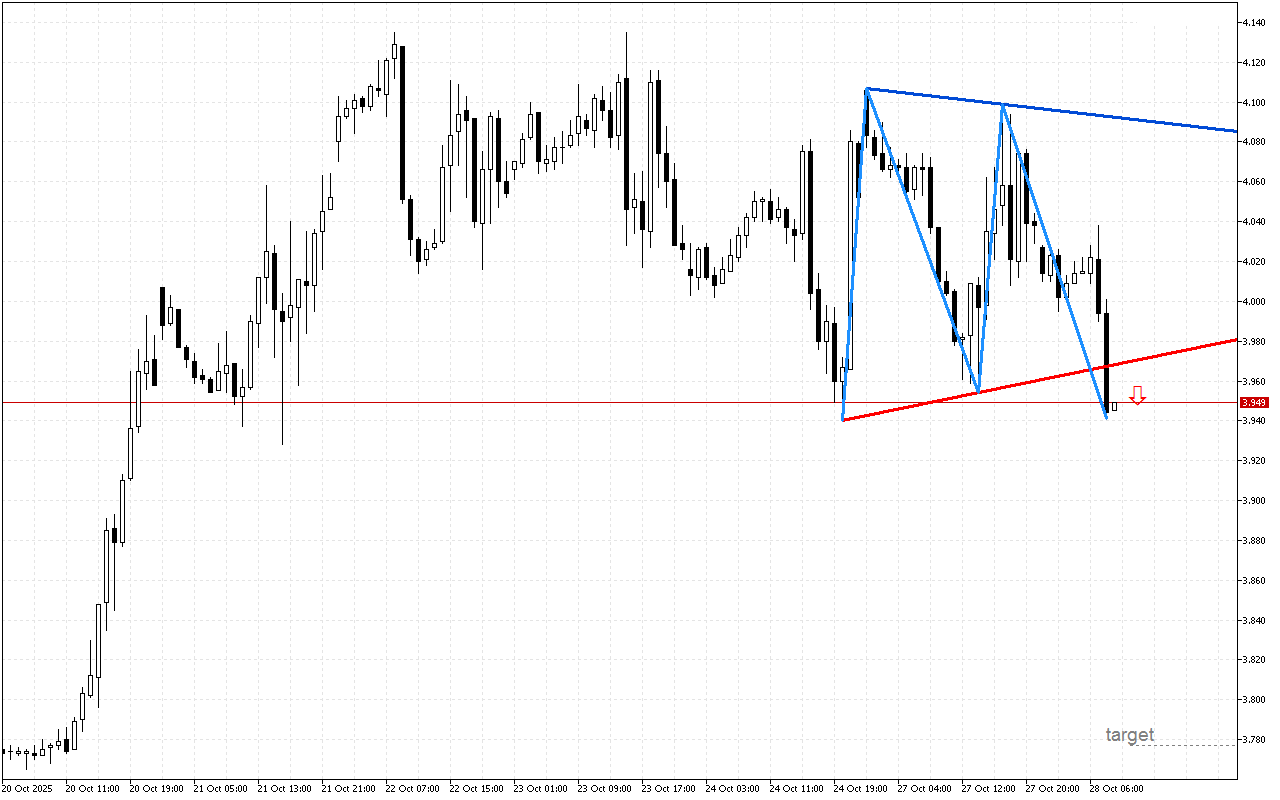
Natural Gas M30: The lower boundary of the symmetrical triangle has been broken lower
The formed pattern on the Natural Gas chart indicates a likely change of trend.The formation…
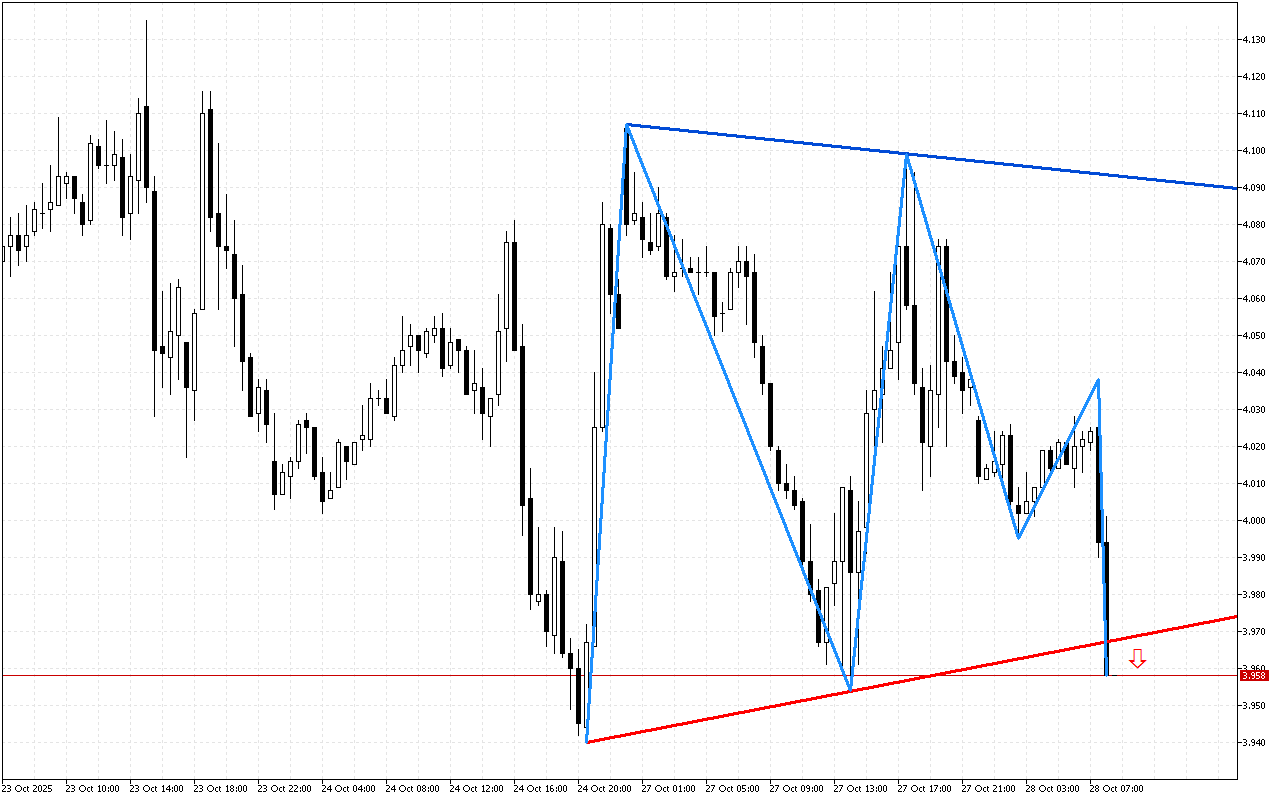
Natural Gas H1: The price moved beyond the lower boundary of the triangle
The characteristics of the previous period indicate that traders could not decide on the direction…
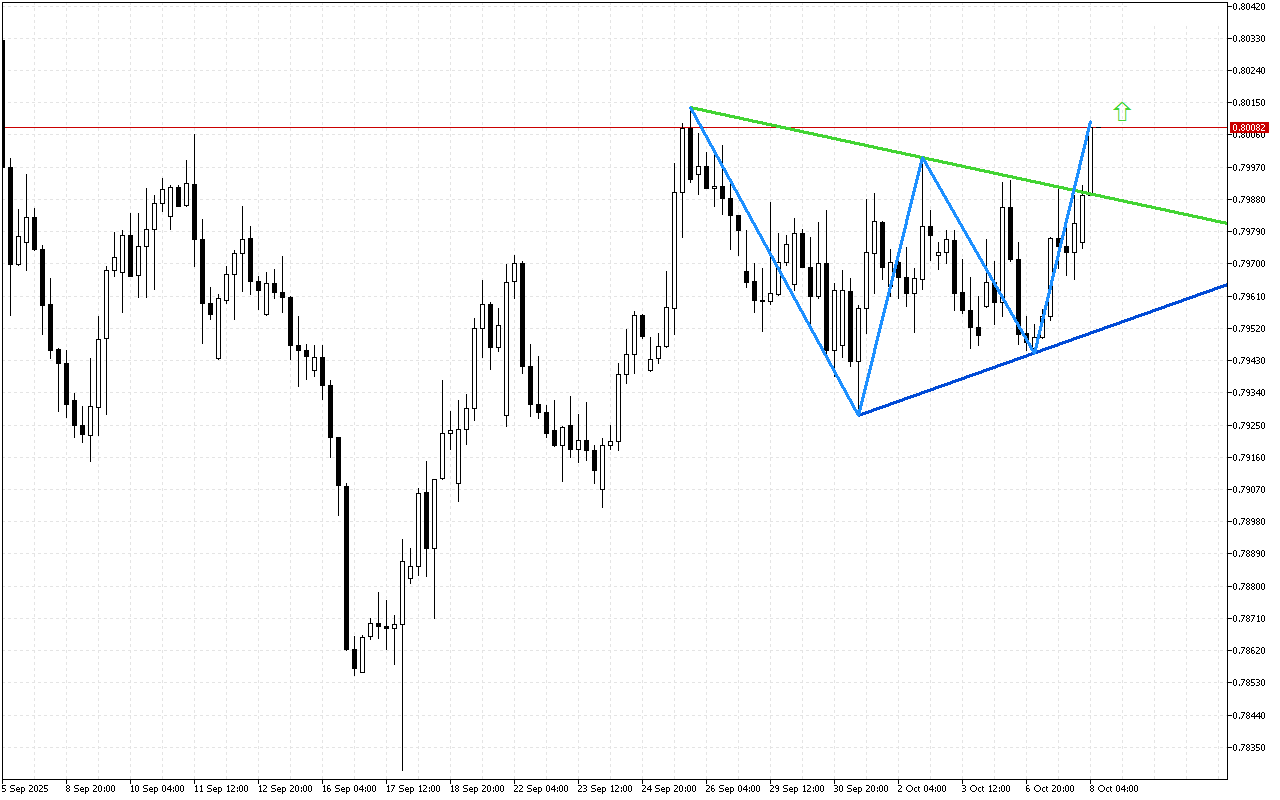
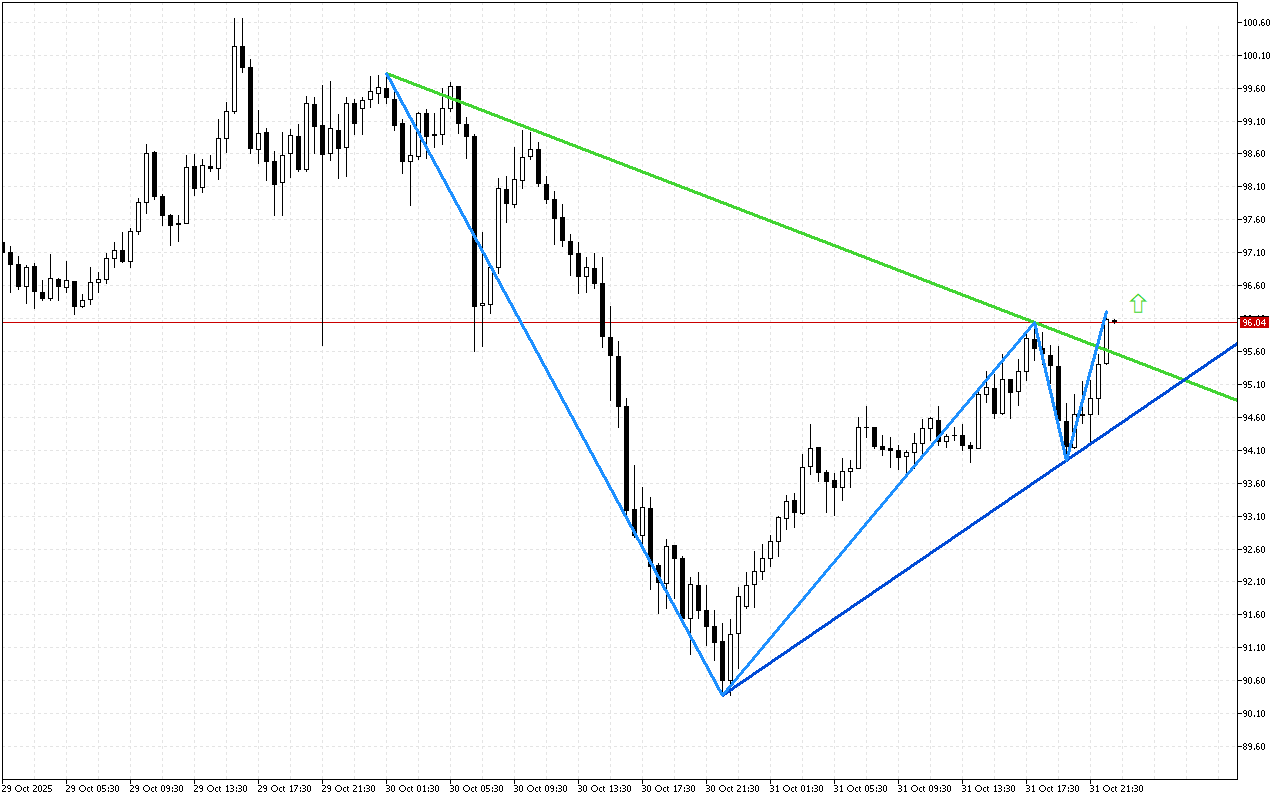
USDCHF M30: The formation of the “Symmetrical Triangle” pattern has completed
Analysis of the USDCHF chart shows that the price may exhibit growth.The formation of a…
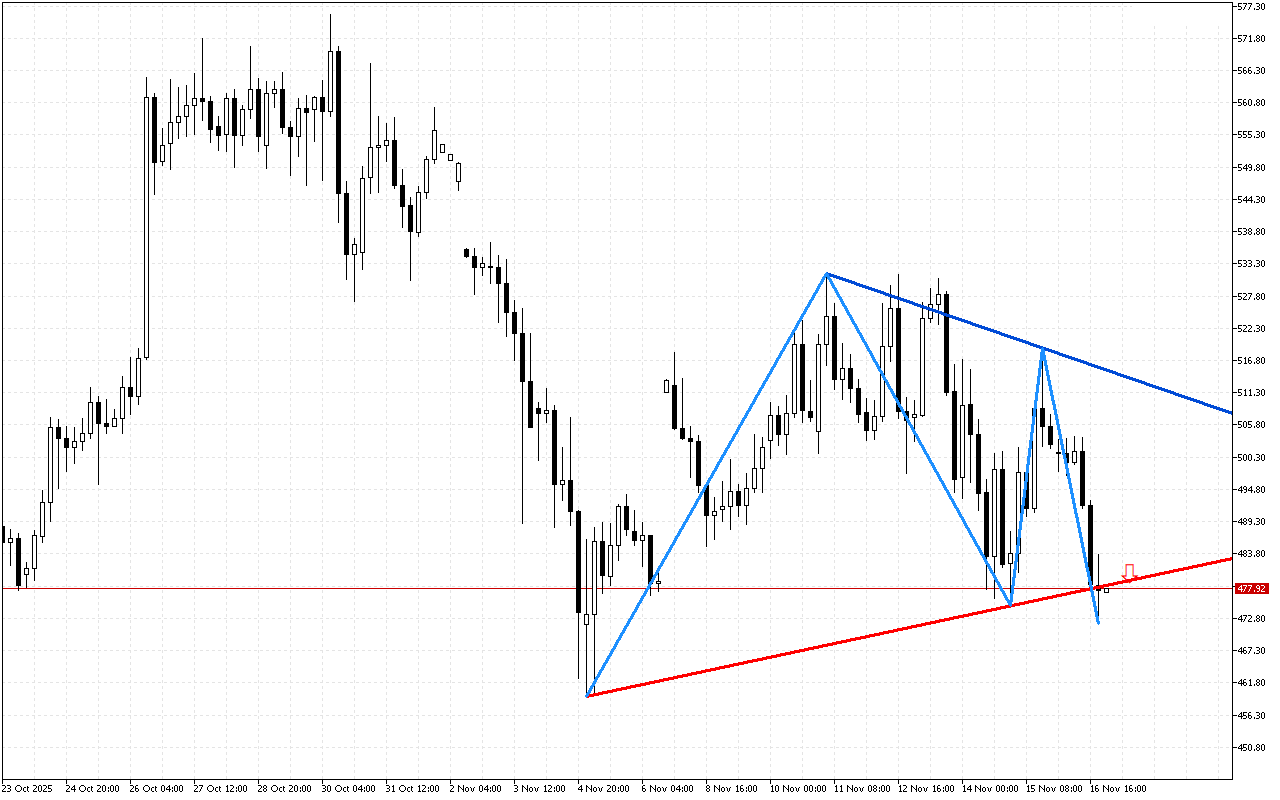
Bit.Cash H4: The downward signal is visualized on the chart
The balance of power in Bit.Cash is gradually changing, as the upward impulse is fading.The…
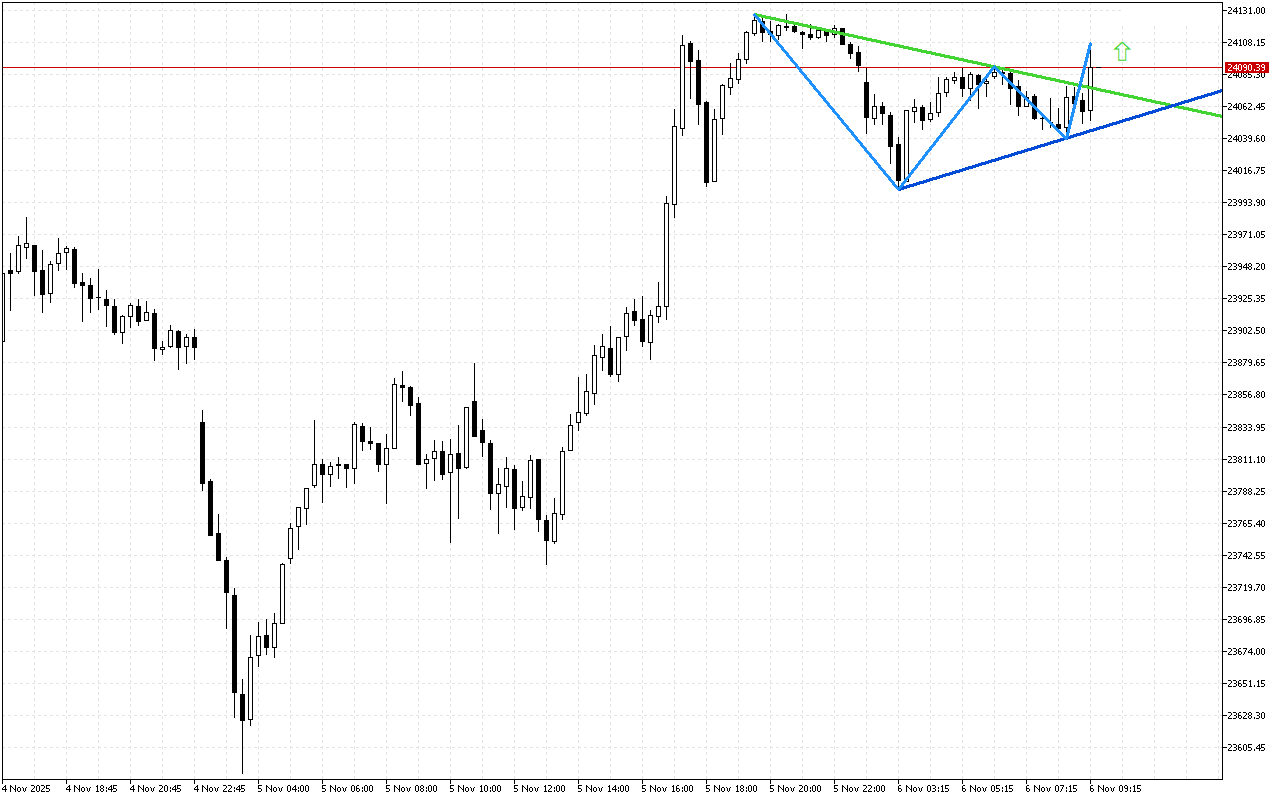
DAX 40 M15: The price breaks through the upper leg of the symmetrical triangle
The formation of a symmetrical triangle indicates consolidation before a breakthrough and an increase in…
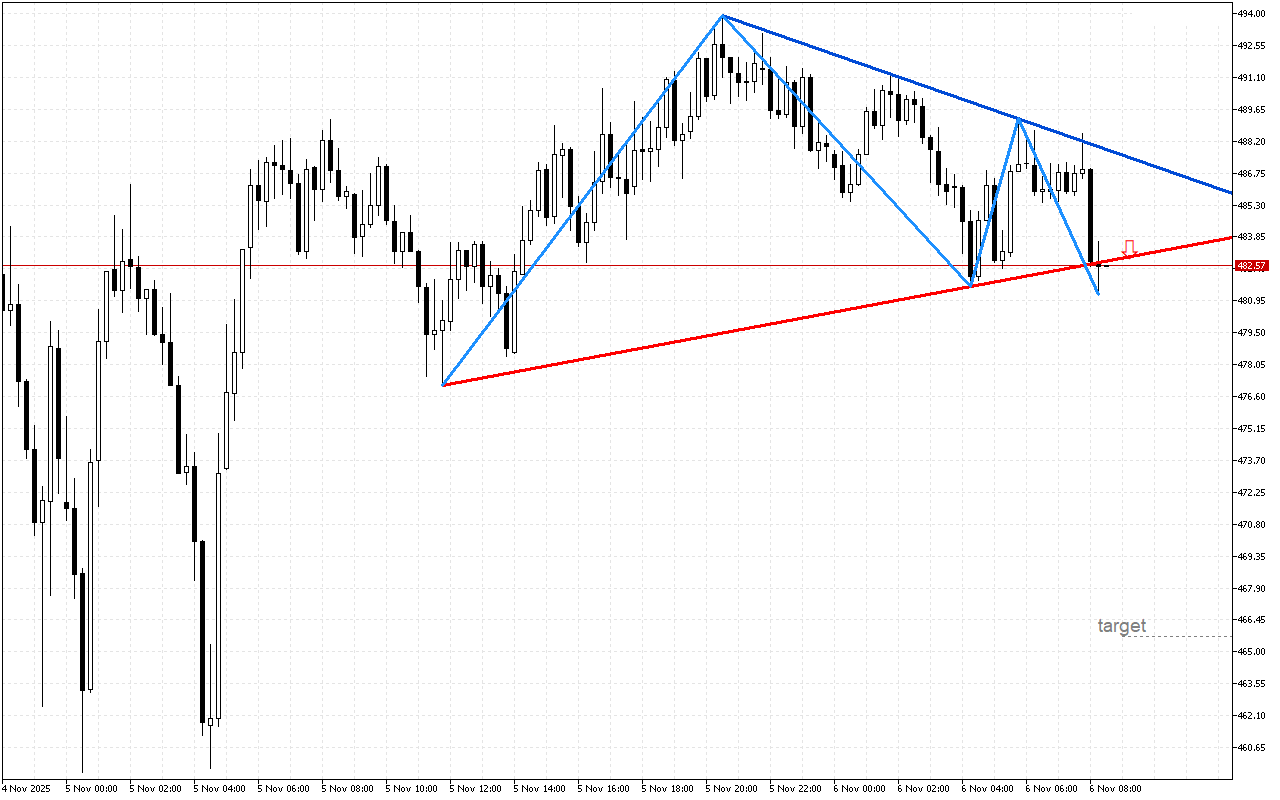
Bit.Cash M15: The downward signal is visualized on the chart
The balance of power in Bit.Cash is gradually changing, as the upward impulse is fading.The…
Bit.Cash M30: The price has formed a symmetrical triangle
Analysis of the Bit.Cash chart shows that the price may exhibit growth.The formation of a…
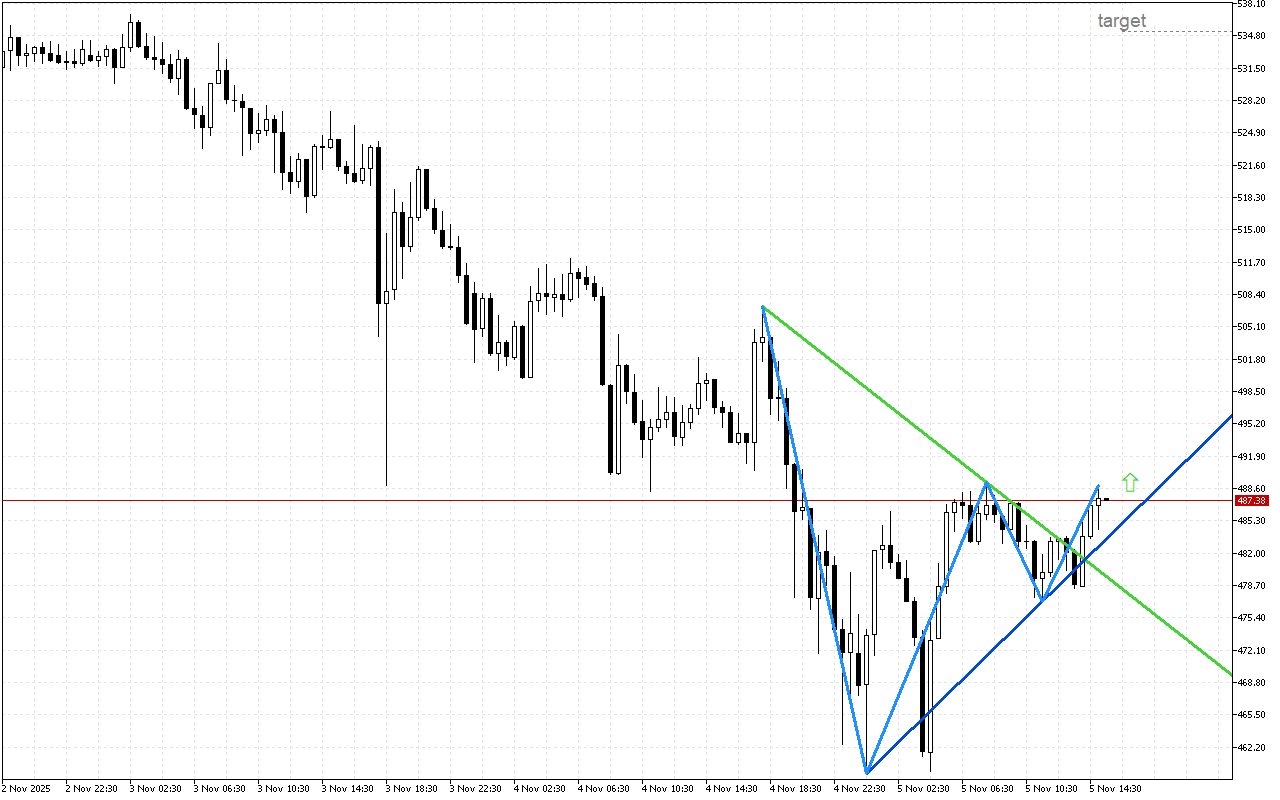
Litecoin M30: The price has formed a symmetrical triangle
Analysis of the Litecoin chart shows that the price may exhibit growth.The formation of a…
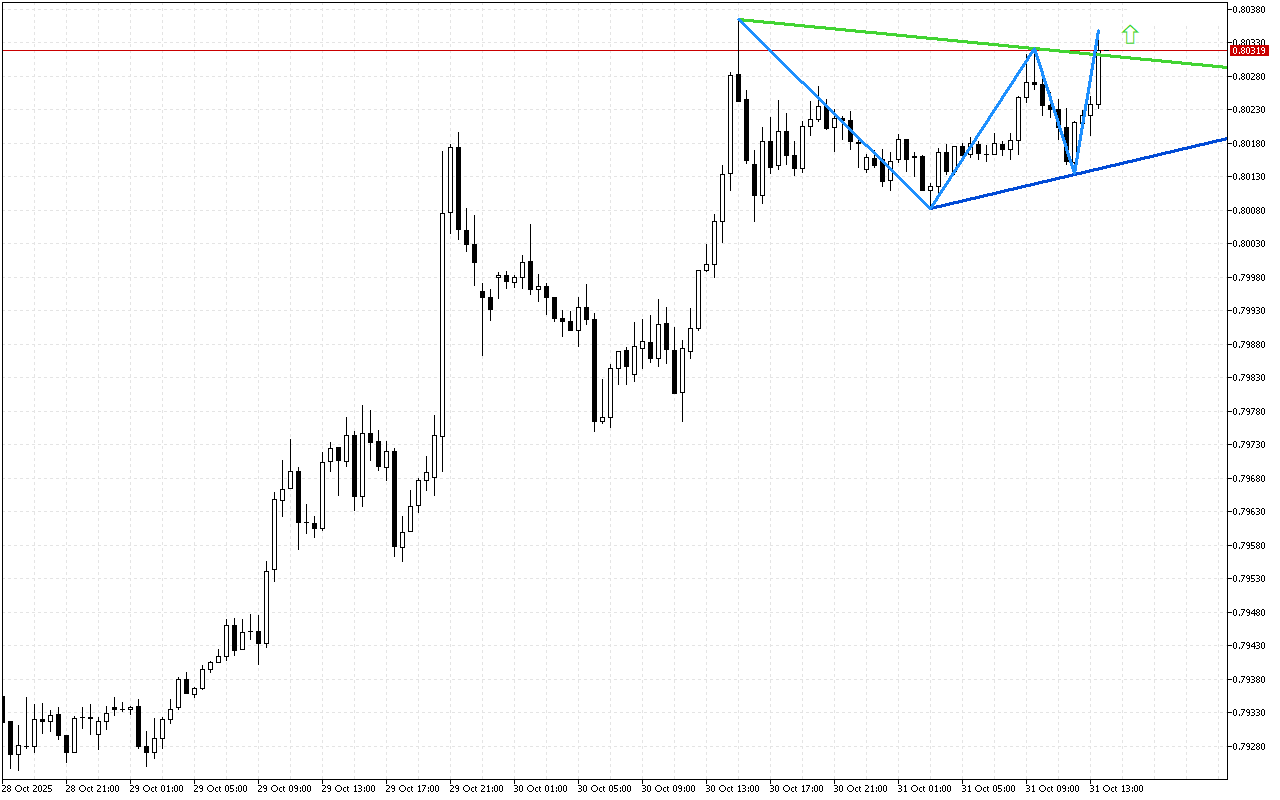
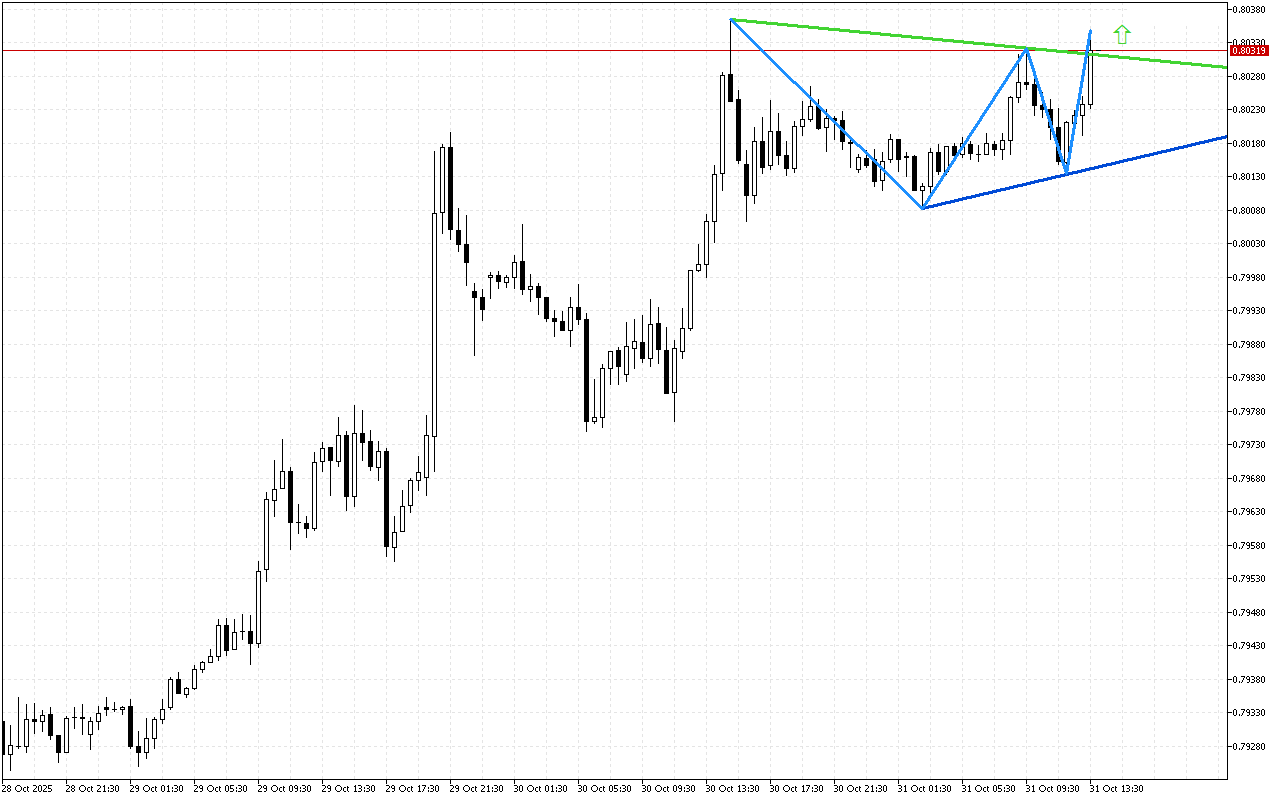
USDCHF M30: The price left the symmetrical triangle upward
Apparently, market participants have decided on the future direction of USDCHF trend.The formation of a…