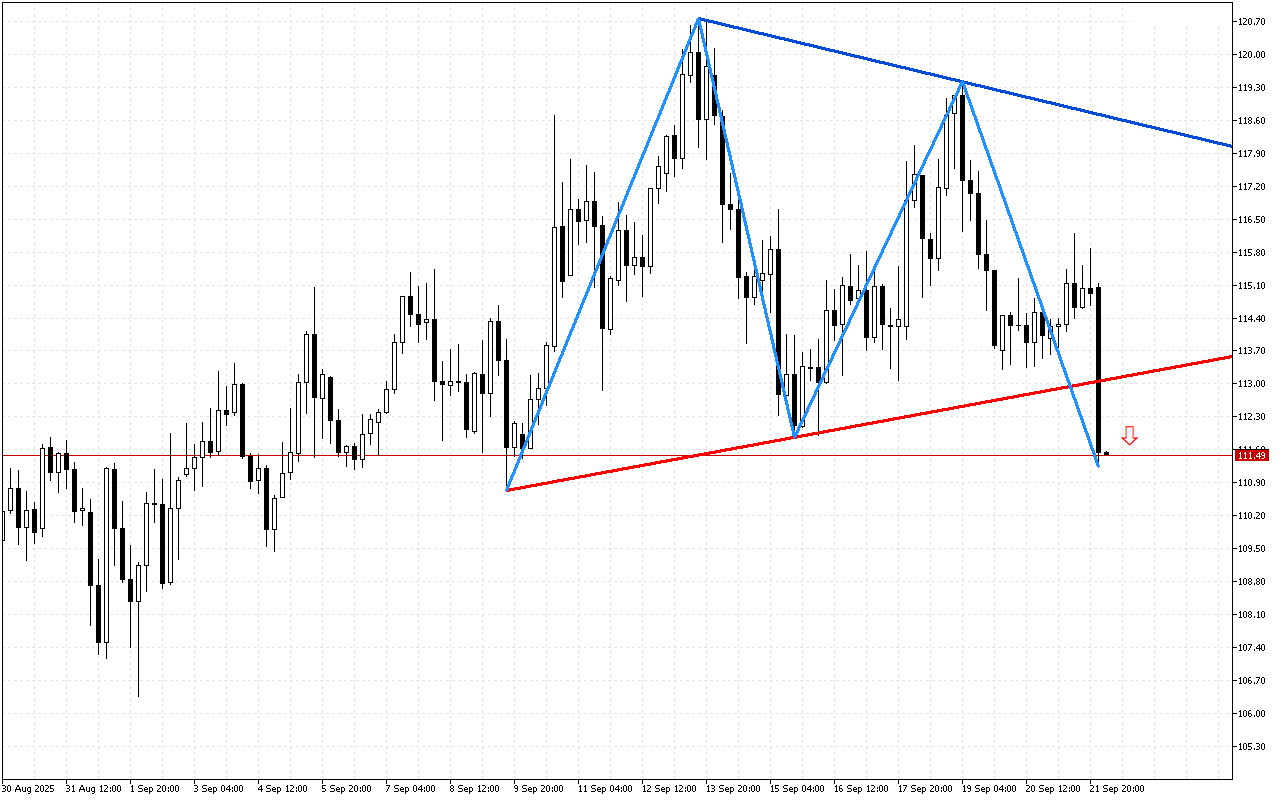
Natural Gas M15: Price exiting the triangle pattern may indicate the end of the uncertainty phase
The Natural Gas chart indicates a likely price decline due to weakening upward momentum.The formation…
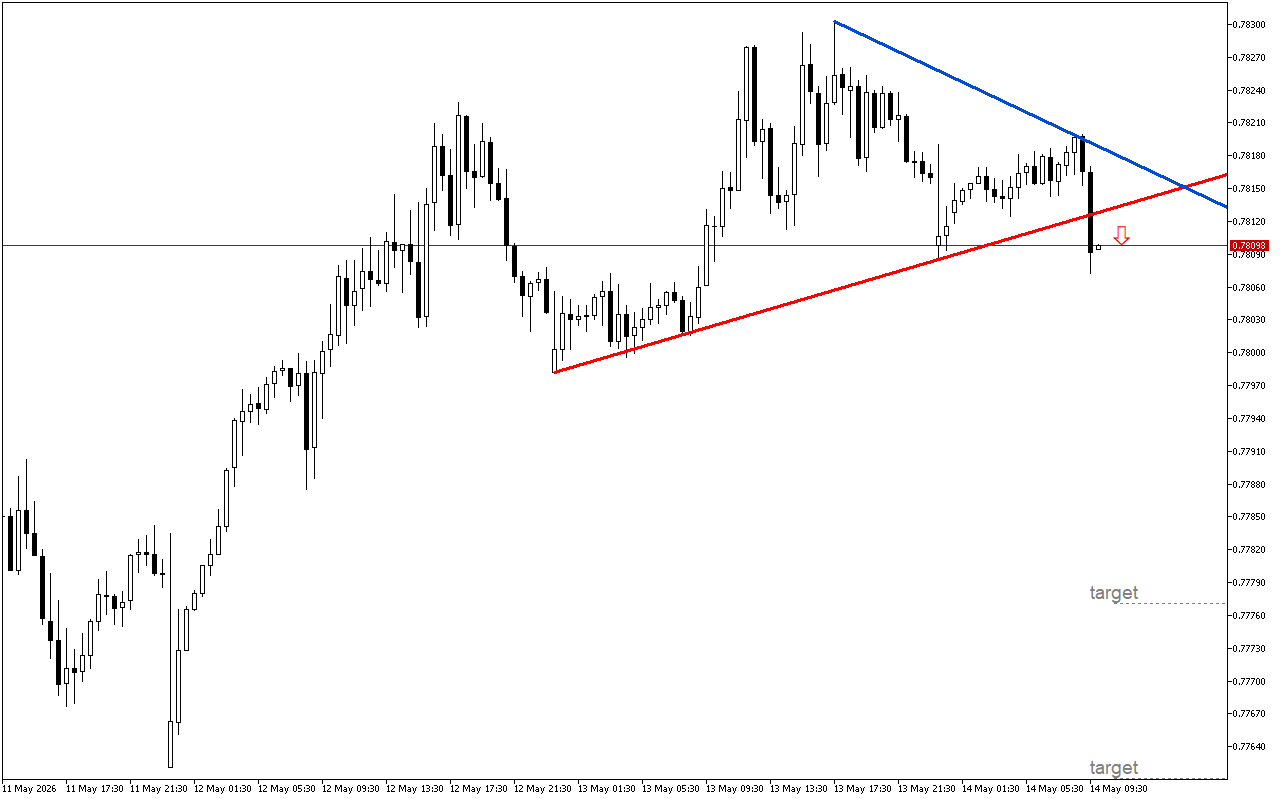
USDCHF H1: If the price leaves the triangle, it can trigger a downward impulse
The USDCHF pattern formed on the chart indicates a potential change of the price direction.The…
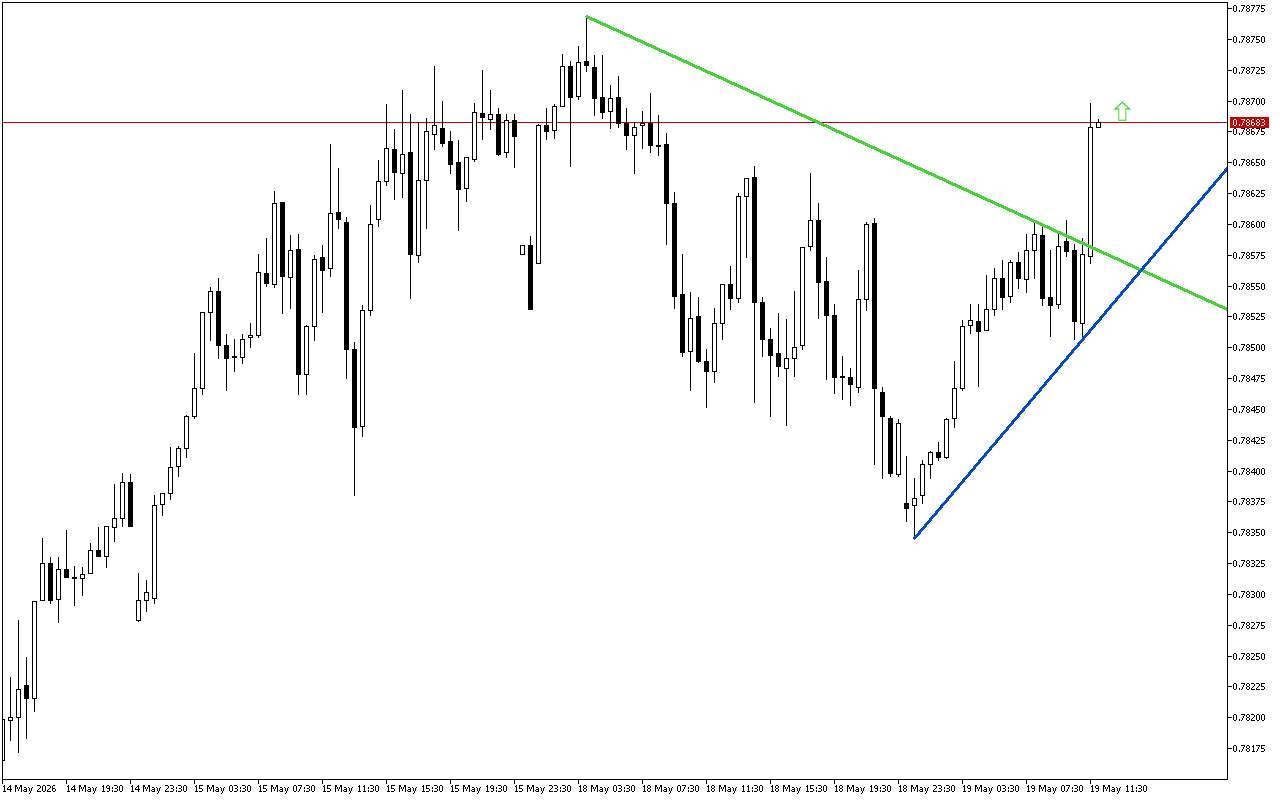
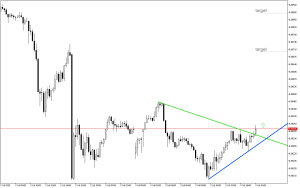
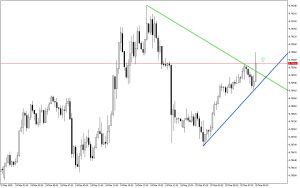
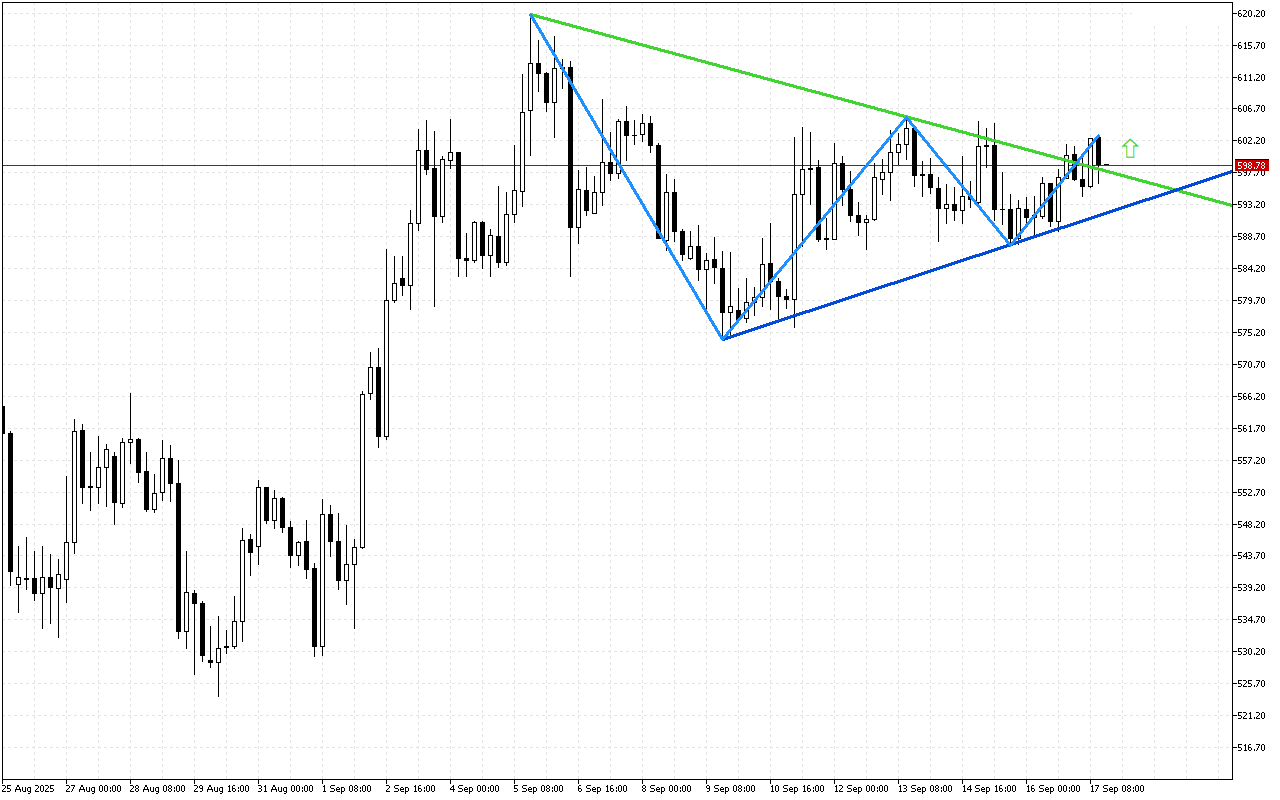
USDCHF M30: Price leaving the triangle generates a signal for growth
The balance of power in USDCHF is gradually improving. Market sentiment is becoming more positive…
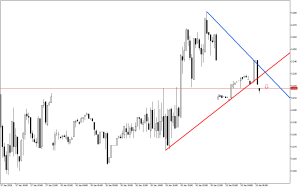
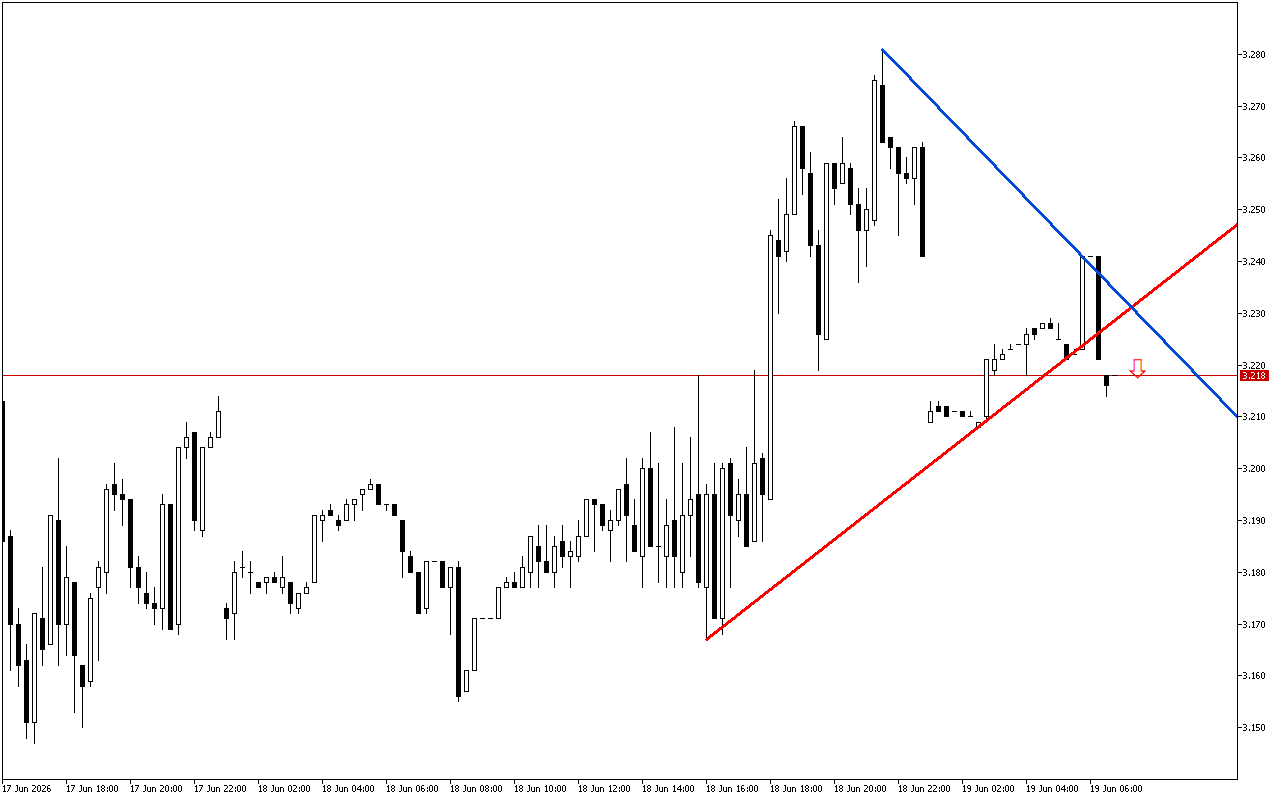
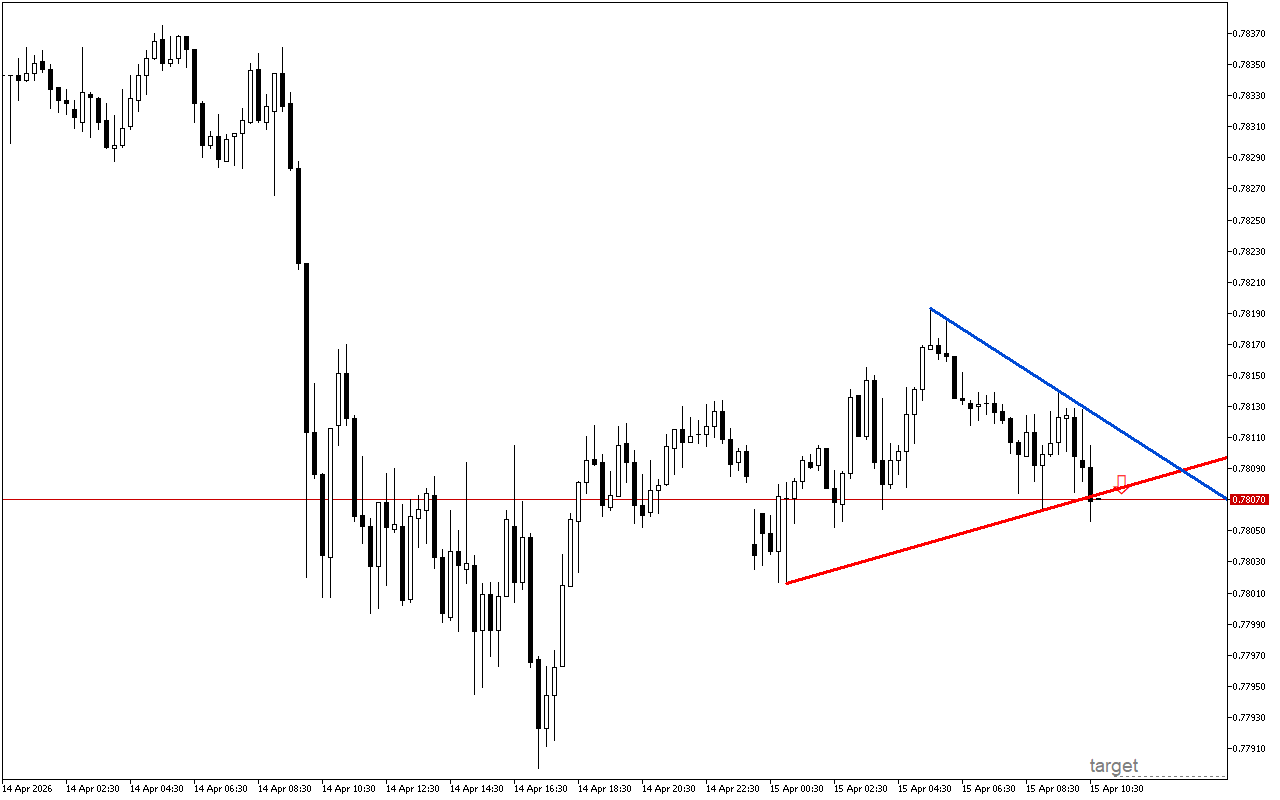
USDCHF M30: The price moved beyond the lower boundary of the triangle
The characteristics of the previous period indicate that traders could not decide on the direction…

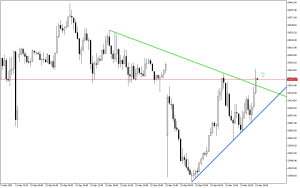
DAX 40 M15: A break through the upper leg of the triangle indicates a change in the balance of forces in the market
Apparently, market participants have decided on the future direction of DAX 40 trend.The formation of…
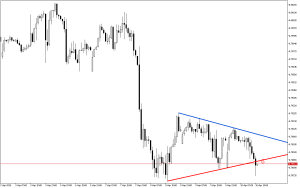
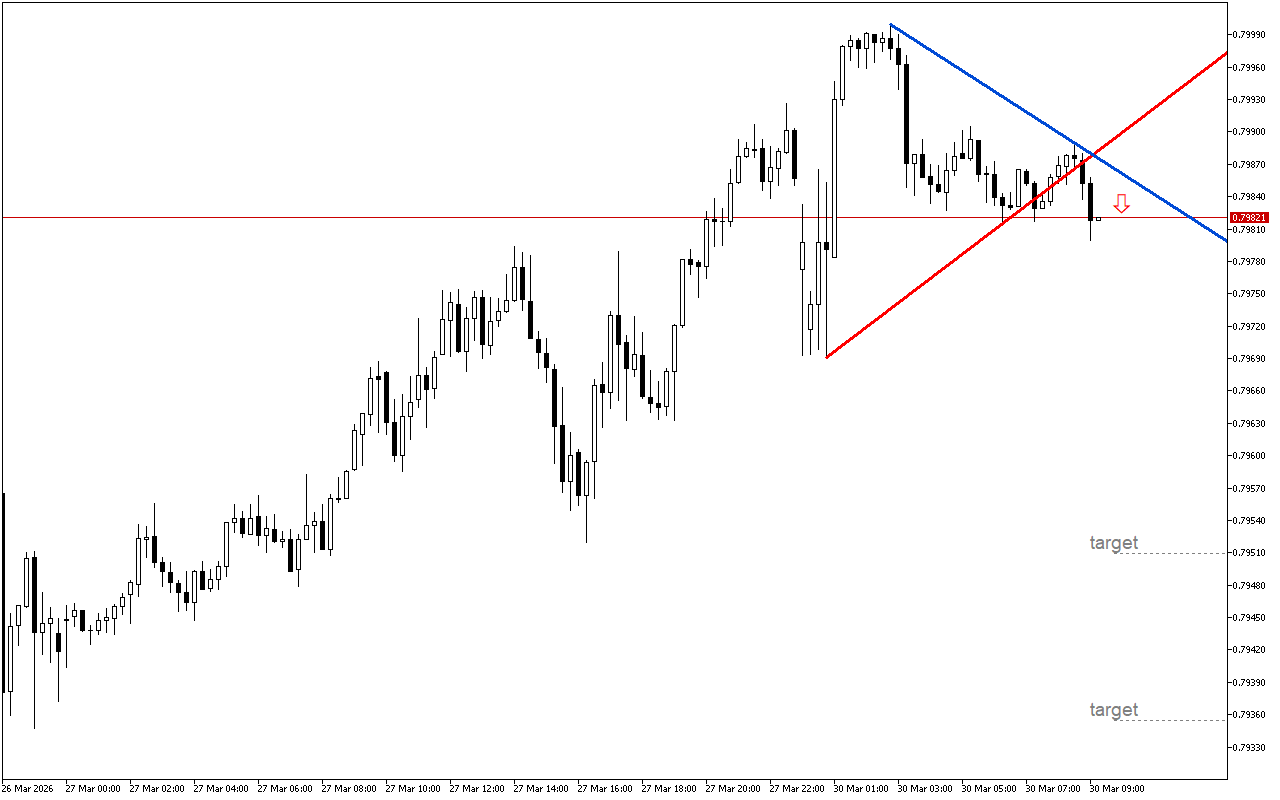
USDCHF M15: The price moved beyond the lower boundary of the triangle
The characteristics of the previous period indicate that traders could not decide on the direction…
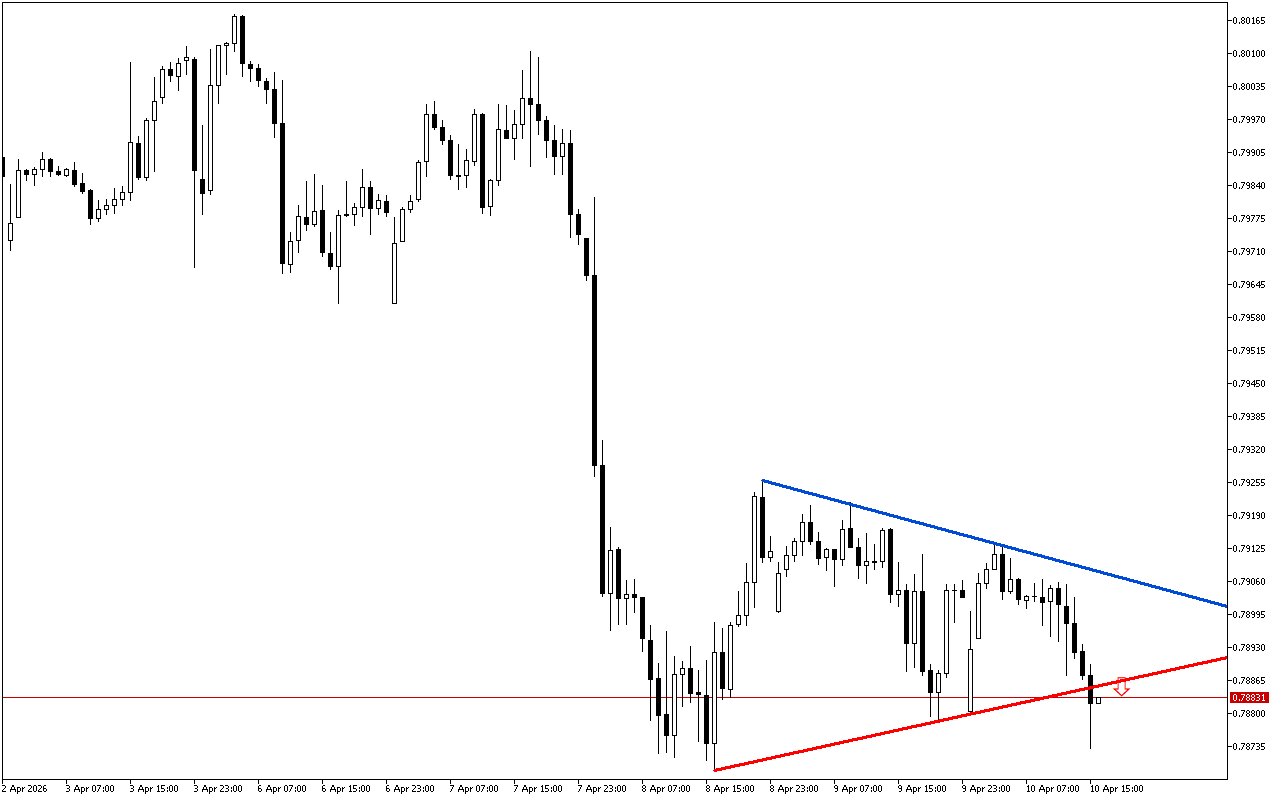
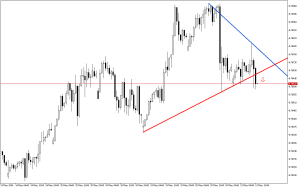
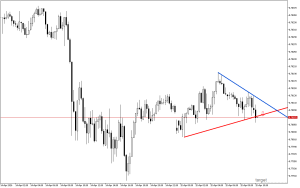
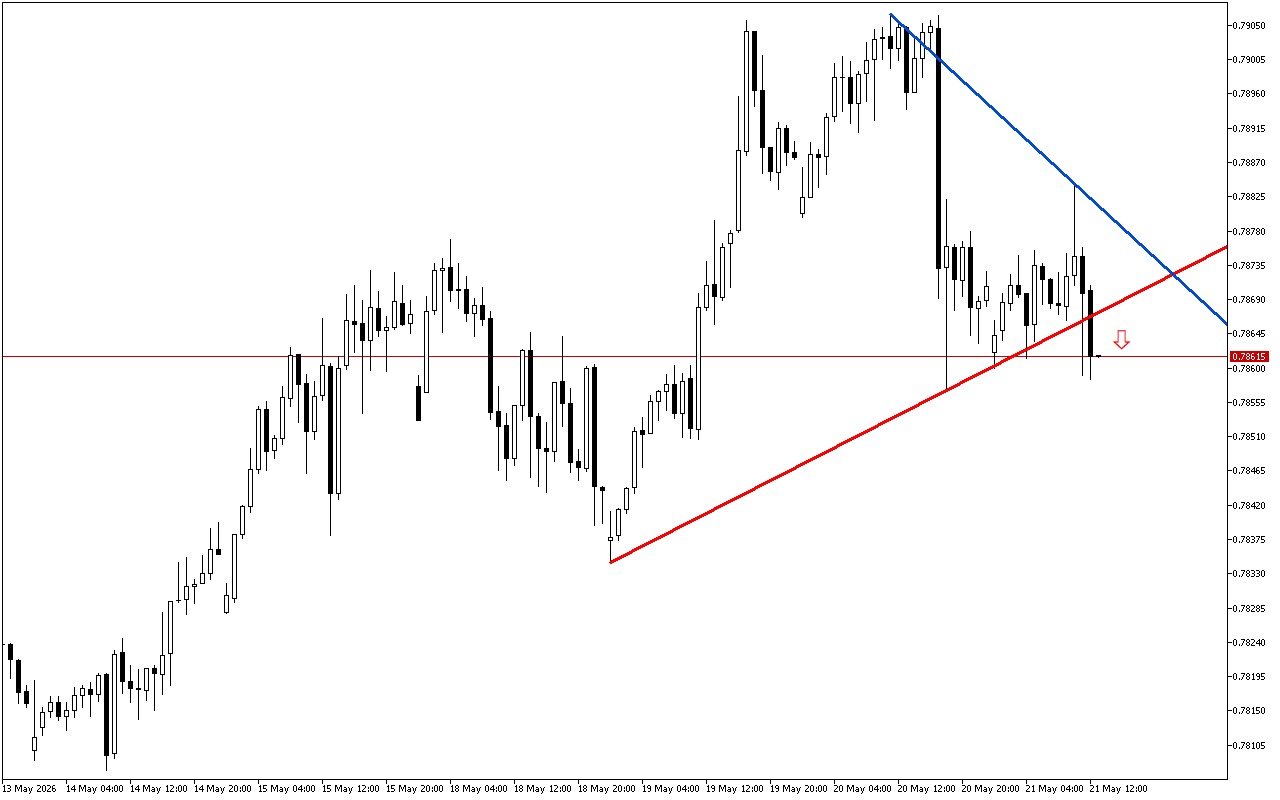
USDCHF H1: The lower boundary of the symmetrical triangle has been broken lower
The formed pattern on the USDCHF chart indicates a likely change of trend.The formation of…
USDCHF M15: The USDCHF price has formed a downward pattern
The balance of power in USDCHF is gradually changing, as the upward impulse is fading.The…

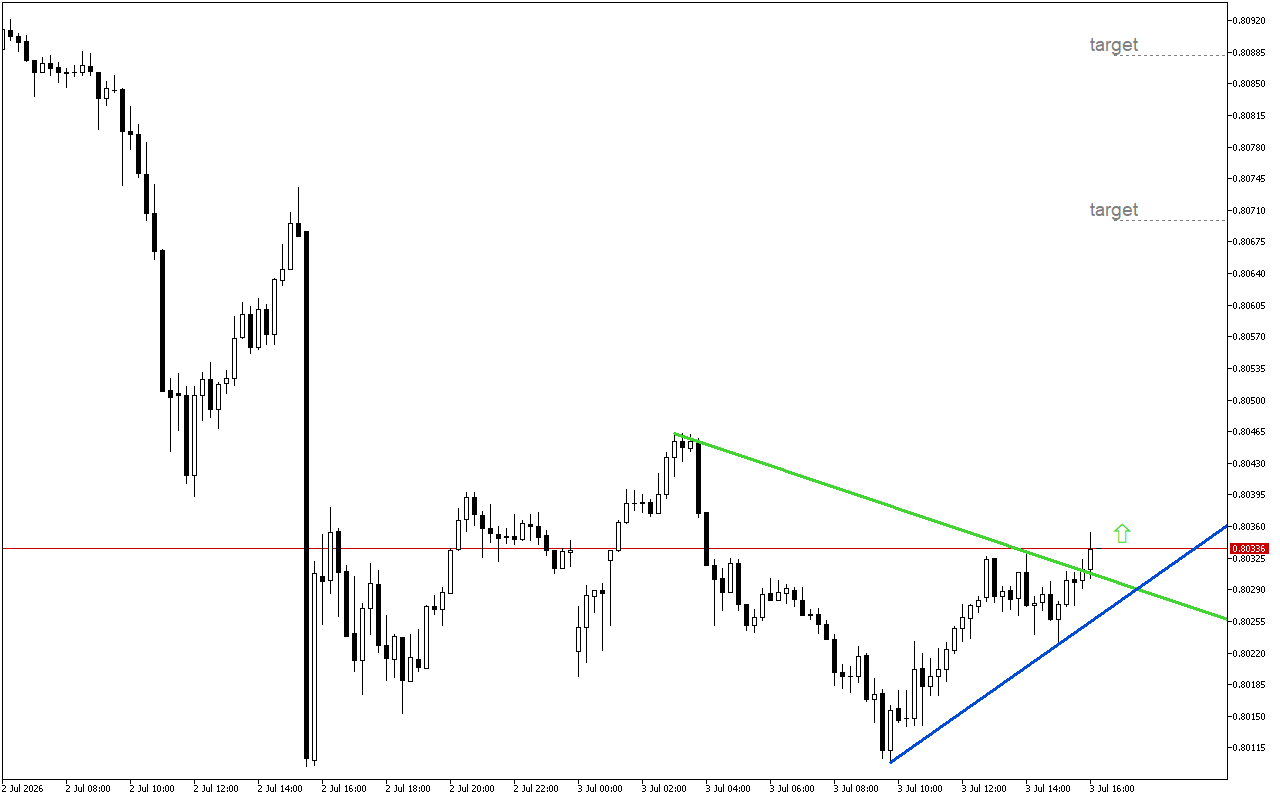
USDCHF M15: The formation of the “Symmetrical Triangle” pattern has completed
Analysis of the USDCHF chart shows that the price may exhibit growth.The formation of a…