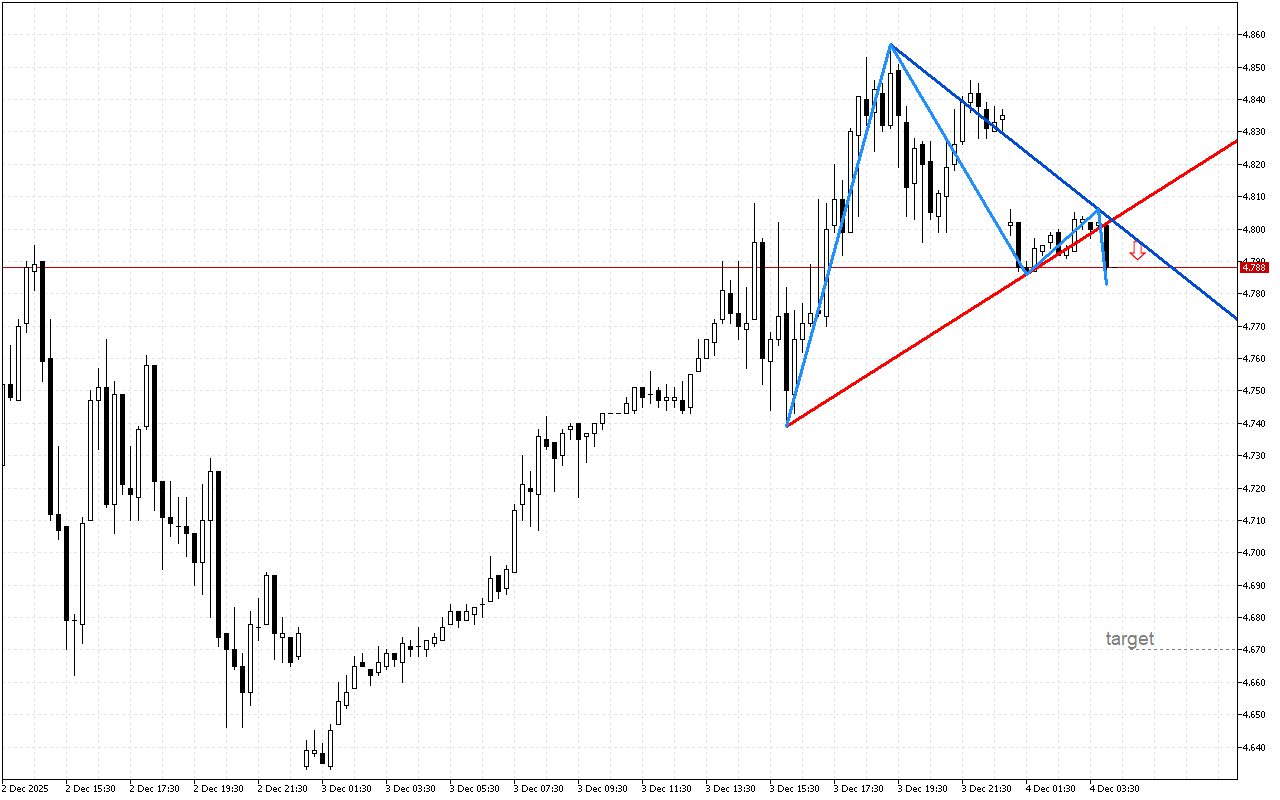
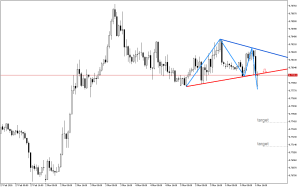
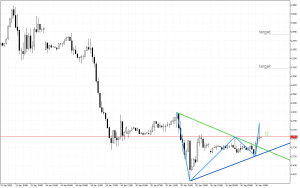
Natural Gas M15: The price line has broken down under the lower boundary of the symmetrical triangle
The Natural Gas chart indicates a likely price decline due to weakening upward momentum.
The formation of a symmetrical triangle can be considered a period of power accumulation before the formation of a new trend. A break through the lower leg of the triangle is often seen as a sign of an impending downward trend.
Thus, in terms of Natural Gas, preference should be given to short positions. A trader can enter the market at or around the current prices or when the resistance level is retested.
📌 Entry: 4.788
✔️ First target: 4.670
✔️ Second target: 4.611
❌ Stop order: 4.857


Post Comment