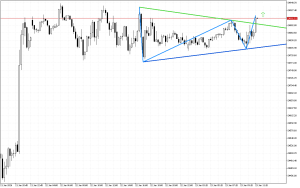
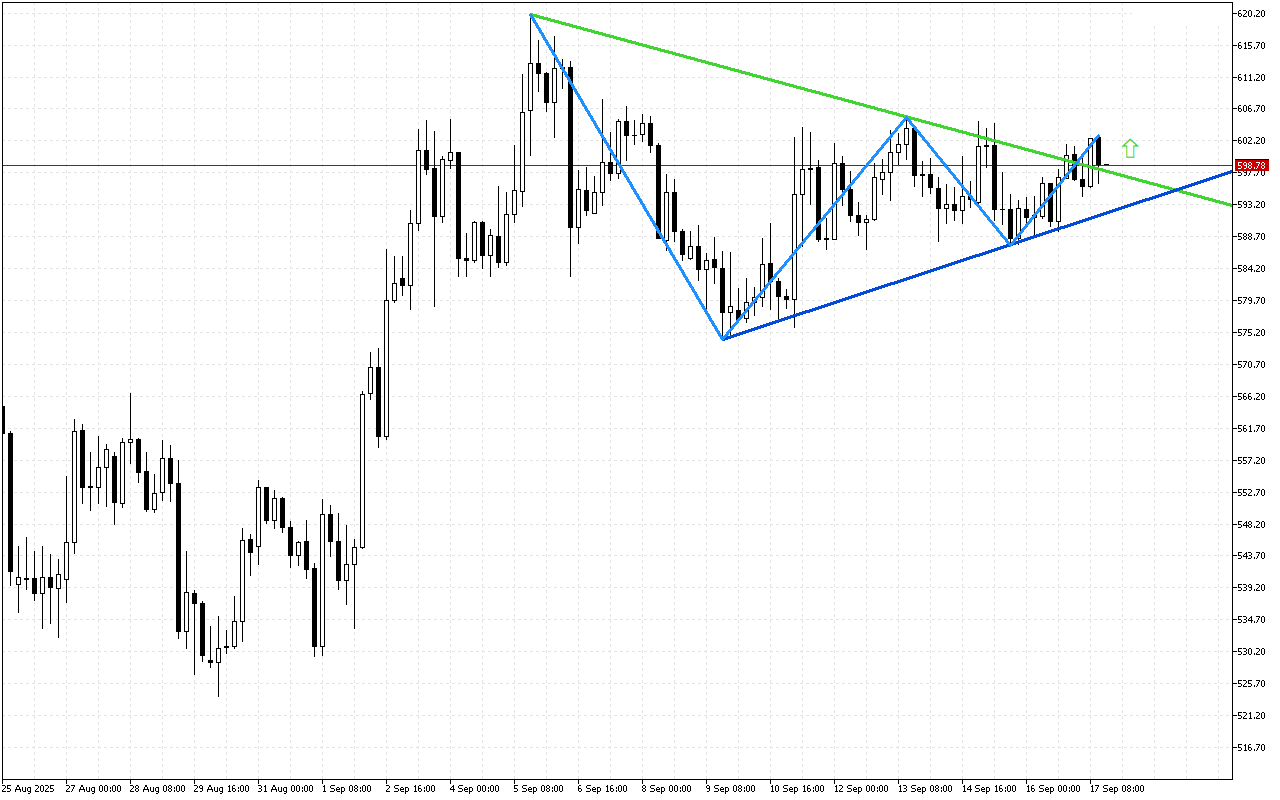

DAX 40 M30: The price is trying to leave the symmetrical triangle by breaking through its upper boundary
The balance of power in DAX 40 is gradually improving. Market sentiment is becoming more…
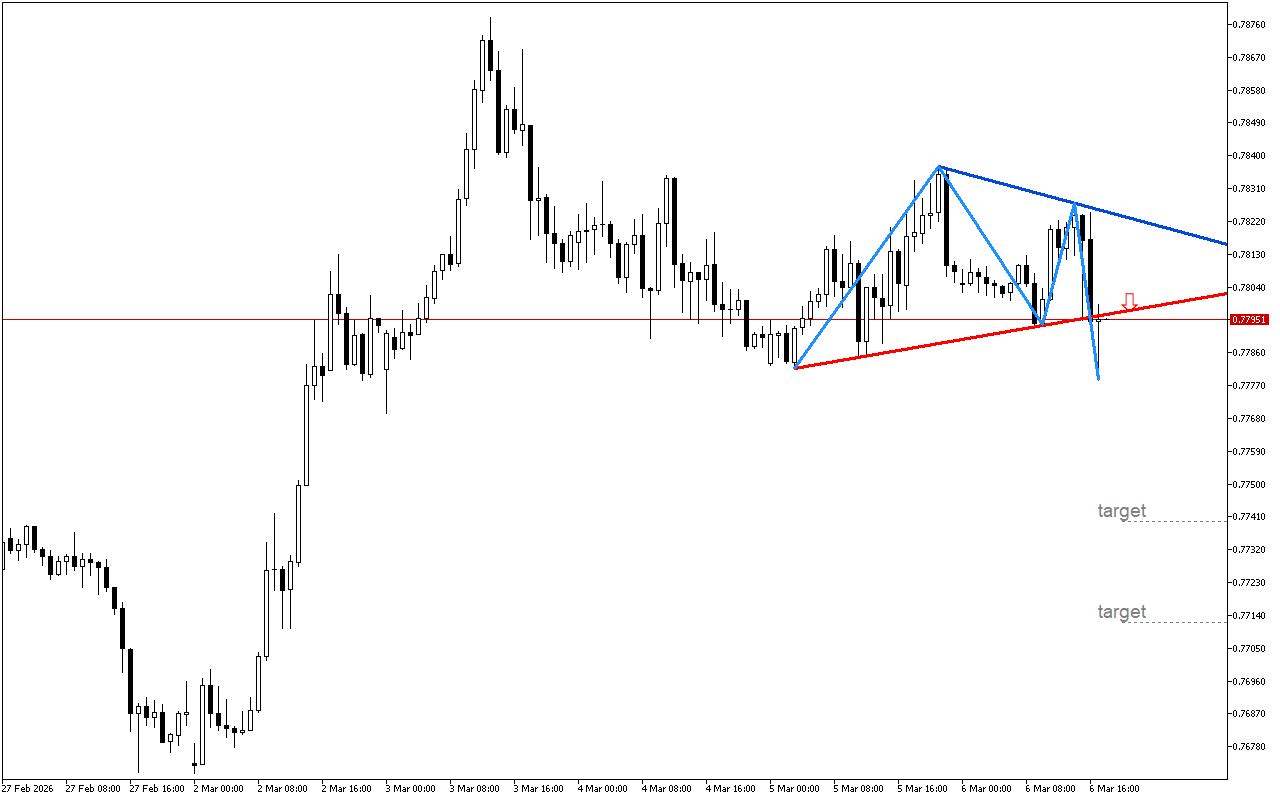
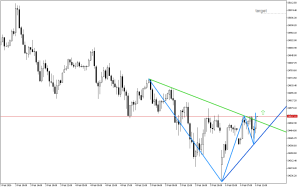
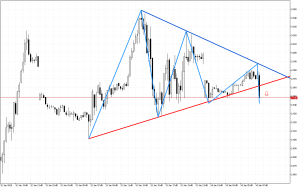
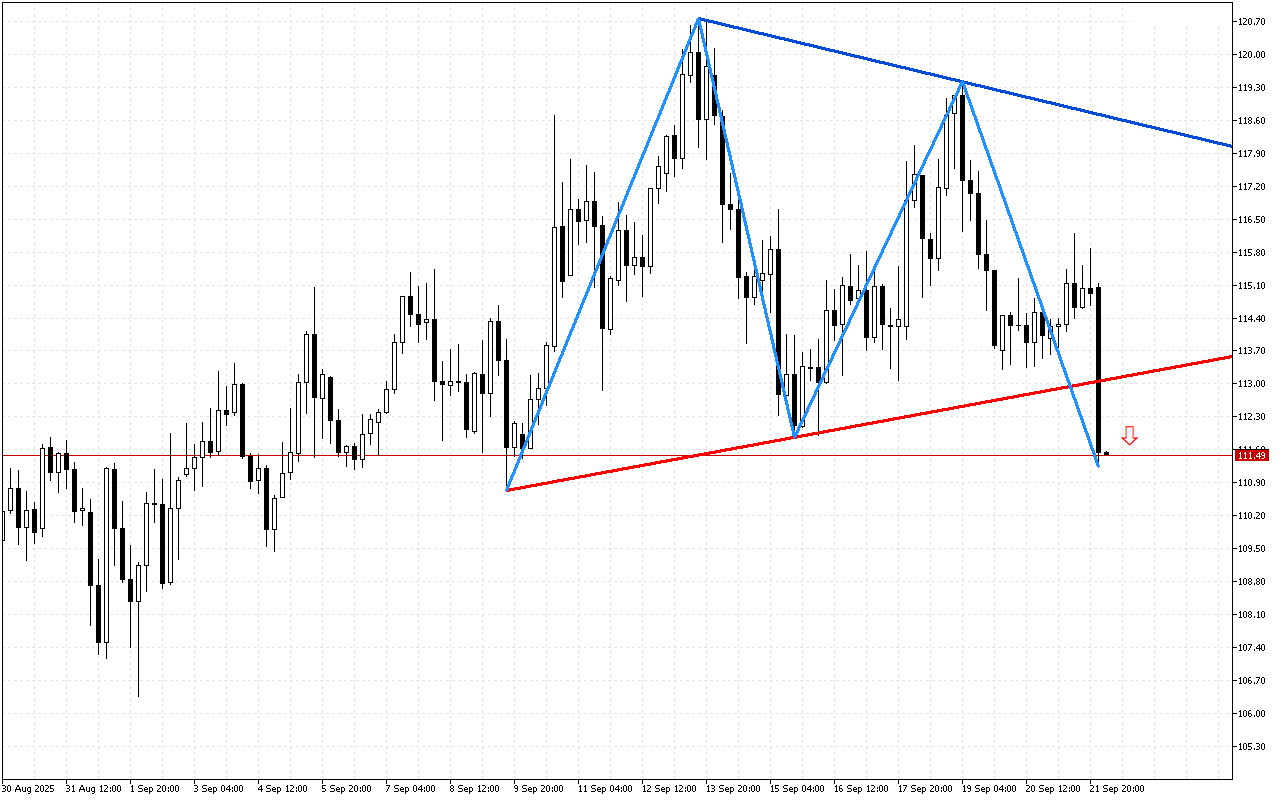
USDCHF H1: The price line has broken down under the lower boundary of the symmetrical triangle
The USDCHF chart indicates a likely price decline due to weakening upward momentum.The formation of…
DAX 40 M30: The price breaks through the upper leg of the symmetrical triangle
The formation of a symmetrical triangle indicates consolidation before a breakthrough and an increase in…

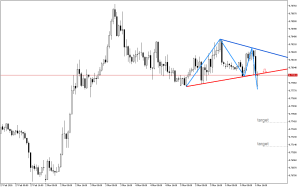
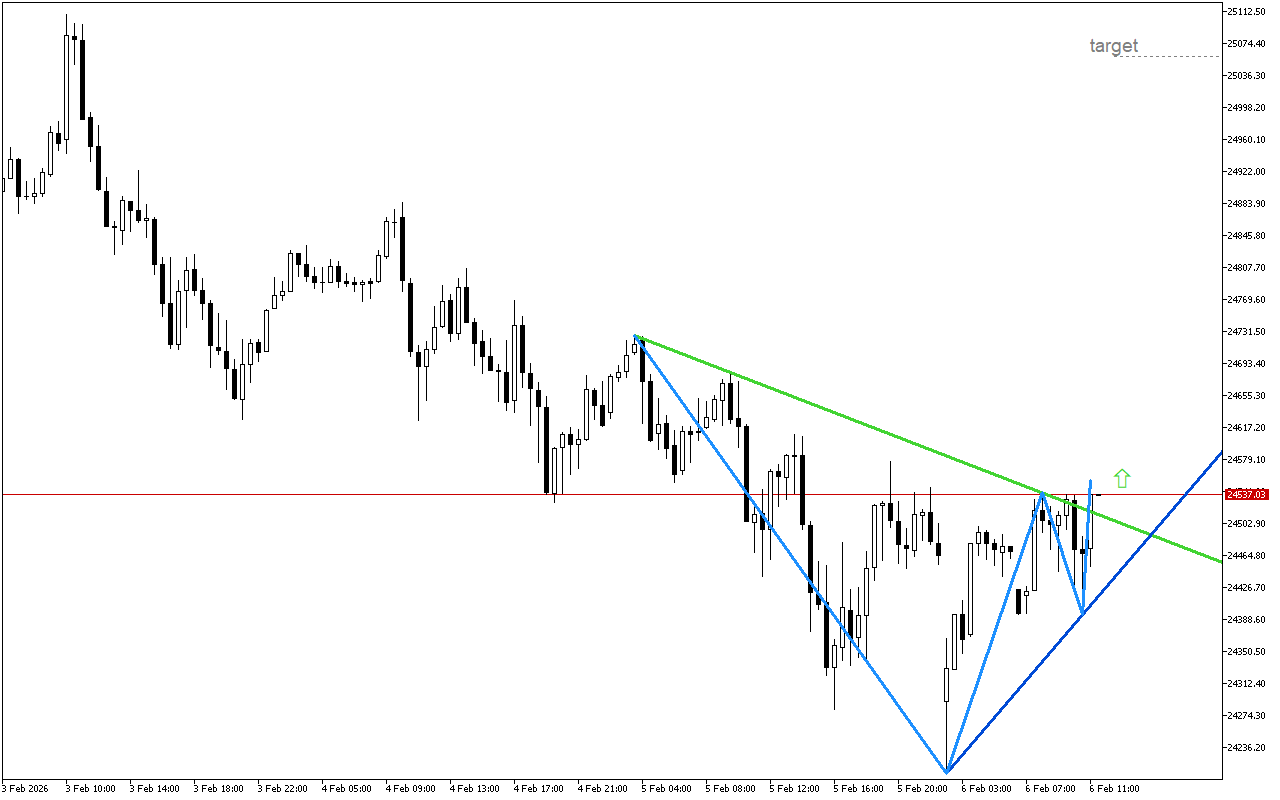
DAX 40 M15: The formation of the “Symmetrical Triangle” pattern has completed
Analysis of the DAX 40 chart shows that the price may exhibit growth.The formation of…
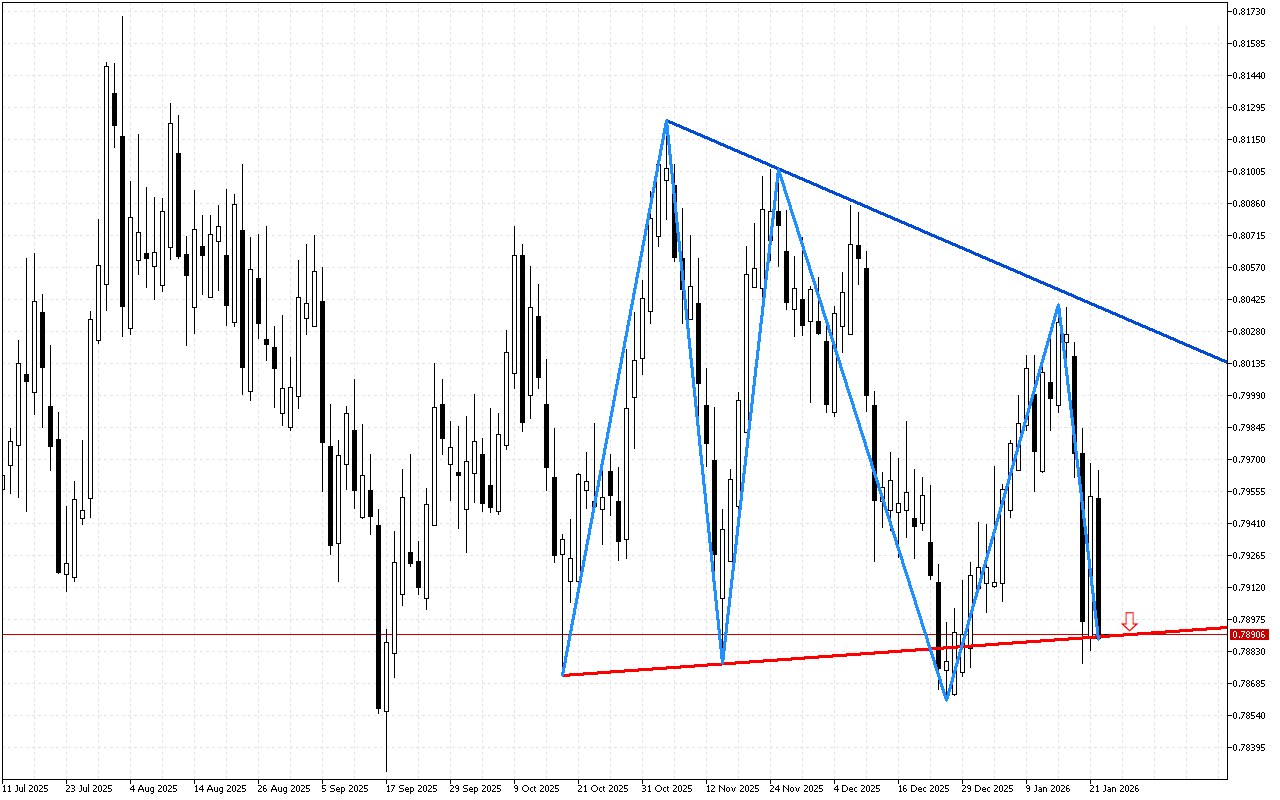
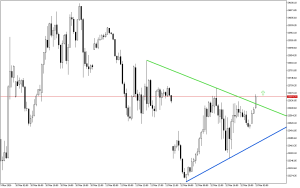
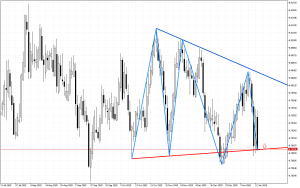
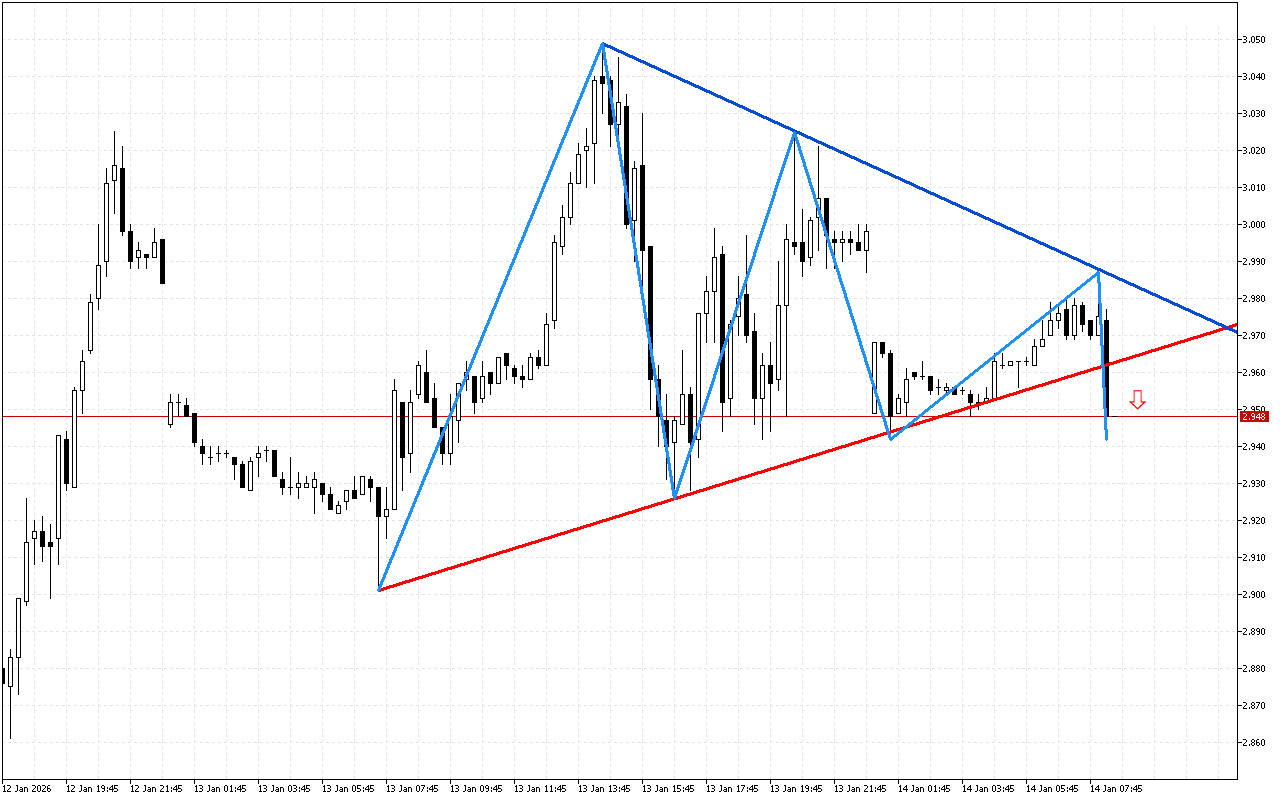
USDCHF D1: The descending triangle figure indicates a possible downward price move
The characteristics of the previous period indicate that traders could not decide on the direction…
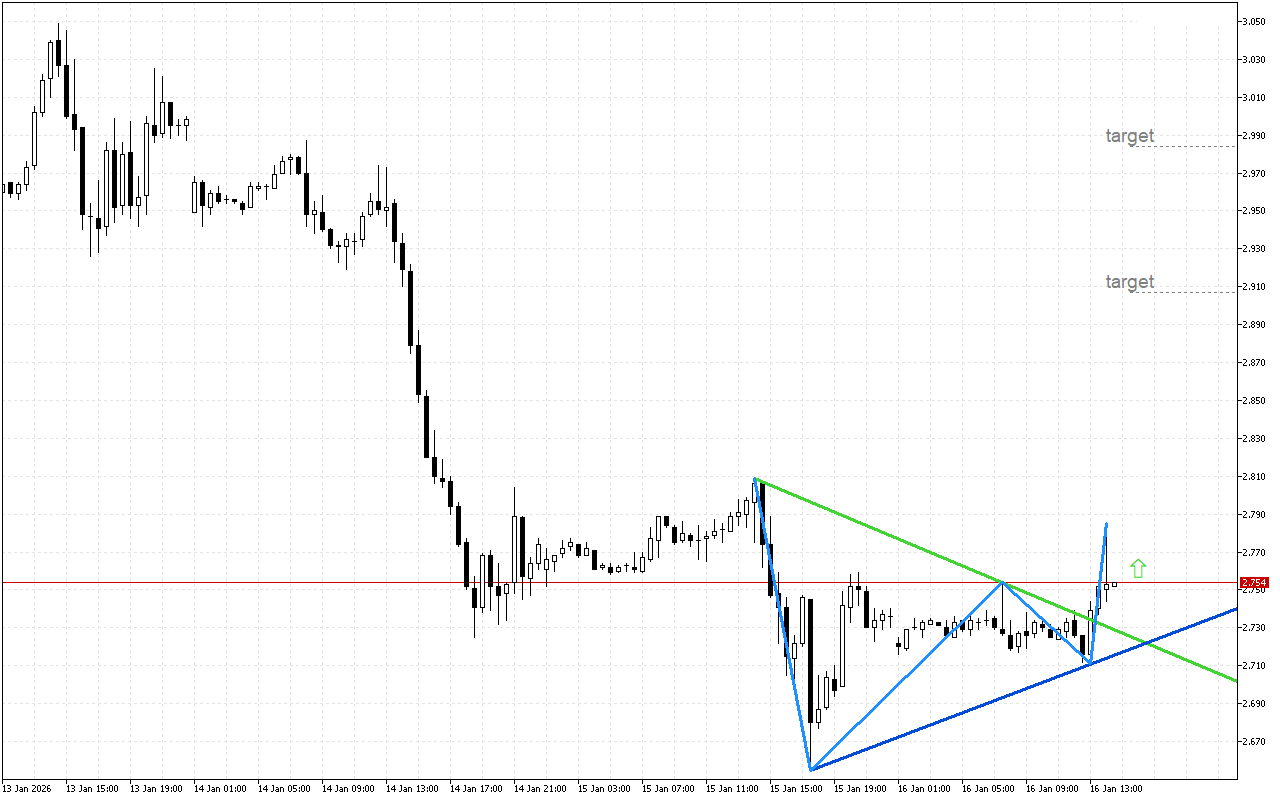
Natural Gas M30: The price is trying to leave the symmetrical triangle by breaking through its upper boundary
The balance of power in Natural Gas is gradually improving. Market sentiment is becoming more…
Natural Gas M15: A symmetrical triangle is formed
The formed pattern on the Natural Gas chart indicates a likely change of trend.The formation…
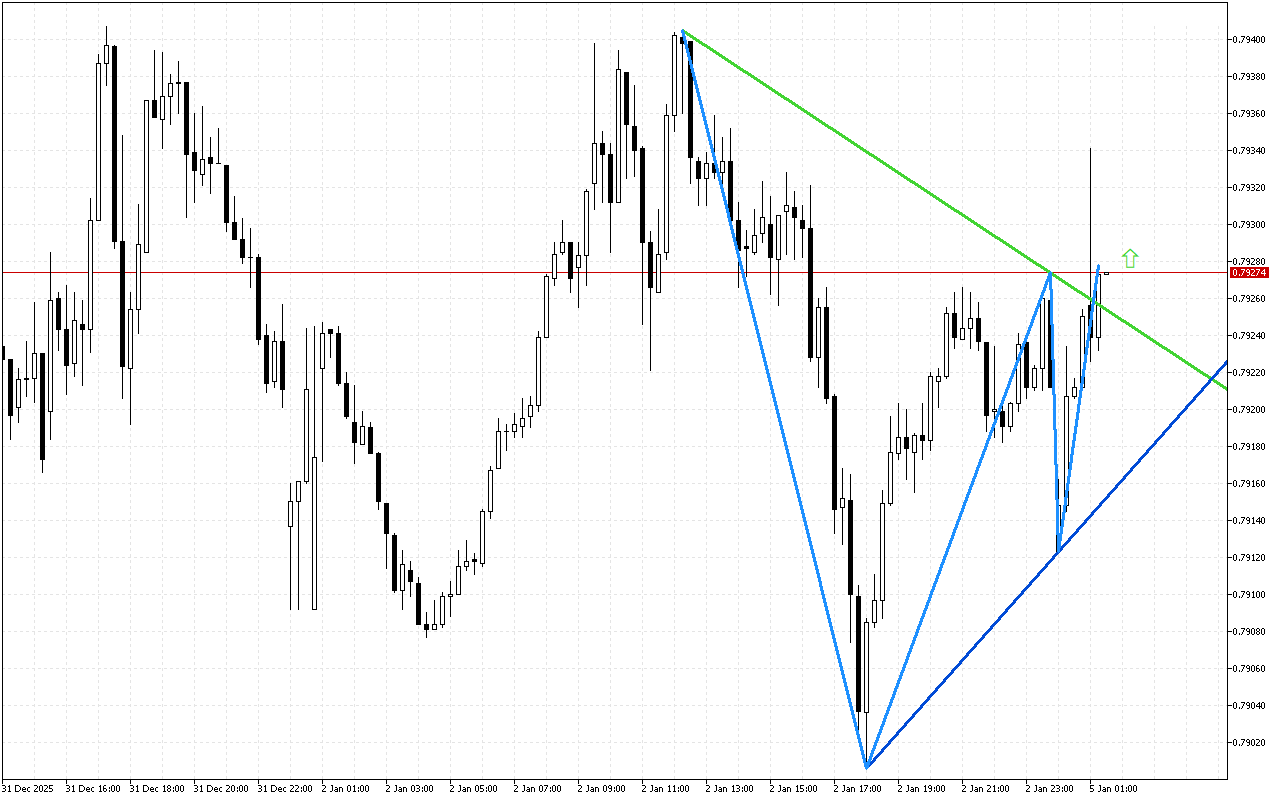
USDCHF M15: Positive signals appeared on the chart
The downward pressure on USDCHF is easing, which may lead to an upward price reversal.The…
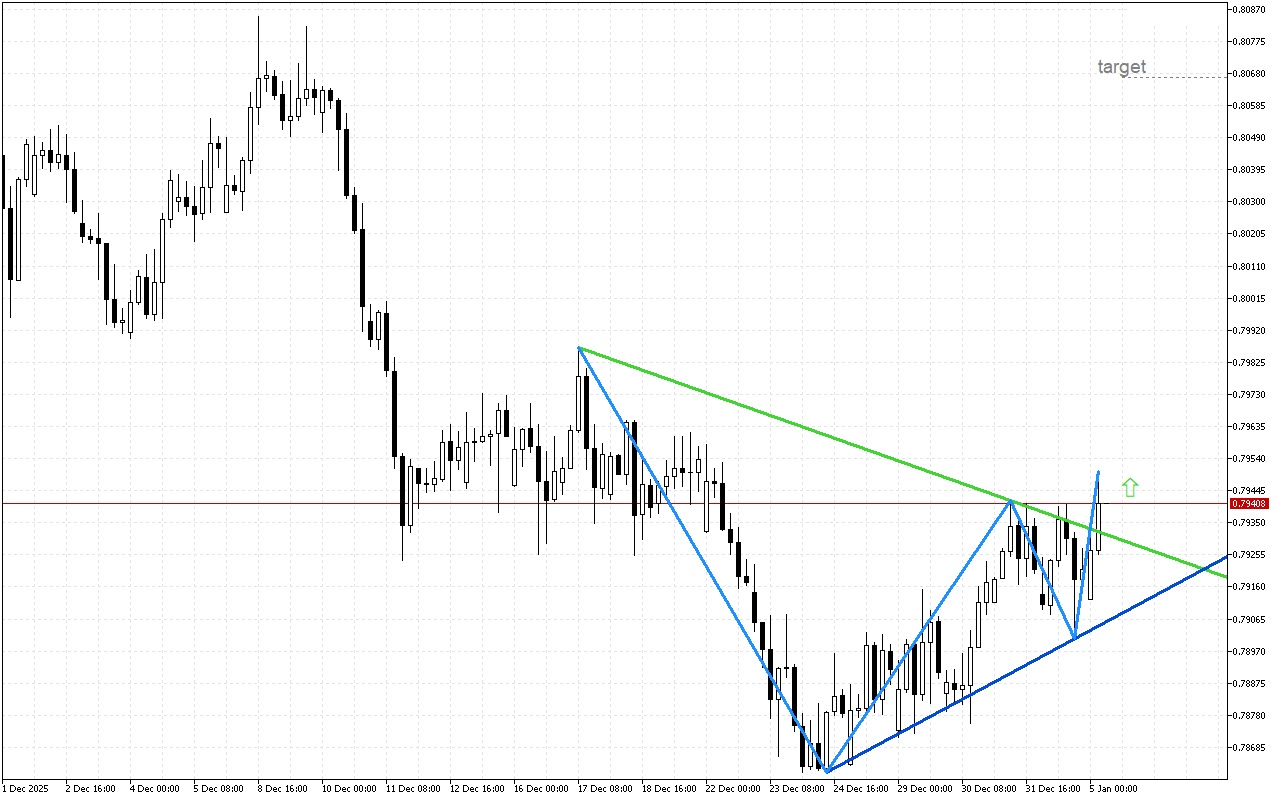
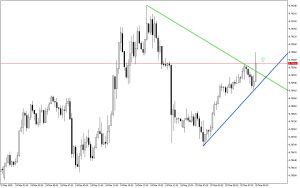
USDCHF H4: The price left the symmetrical triangle upward
Apparently, market participants have decided on the future direction of USDCHF trend.The formation of a…