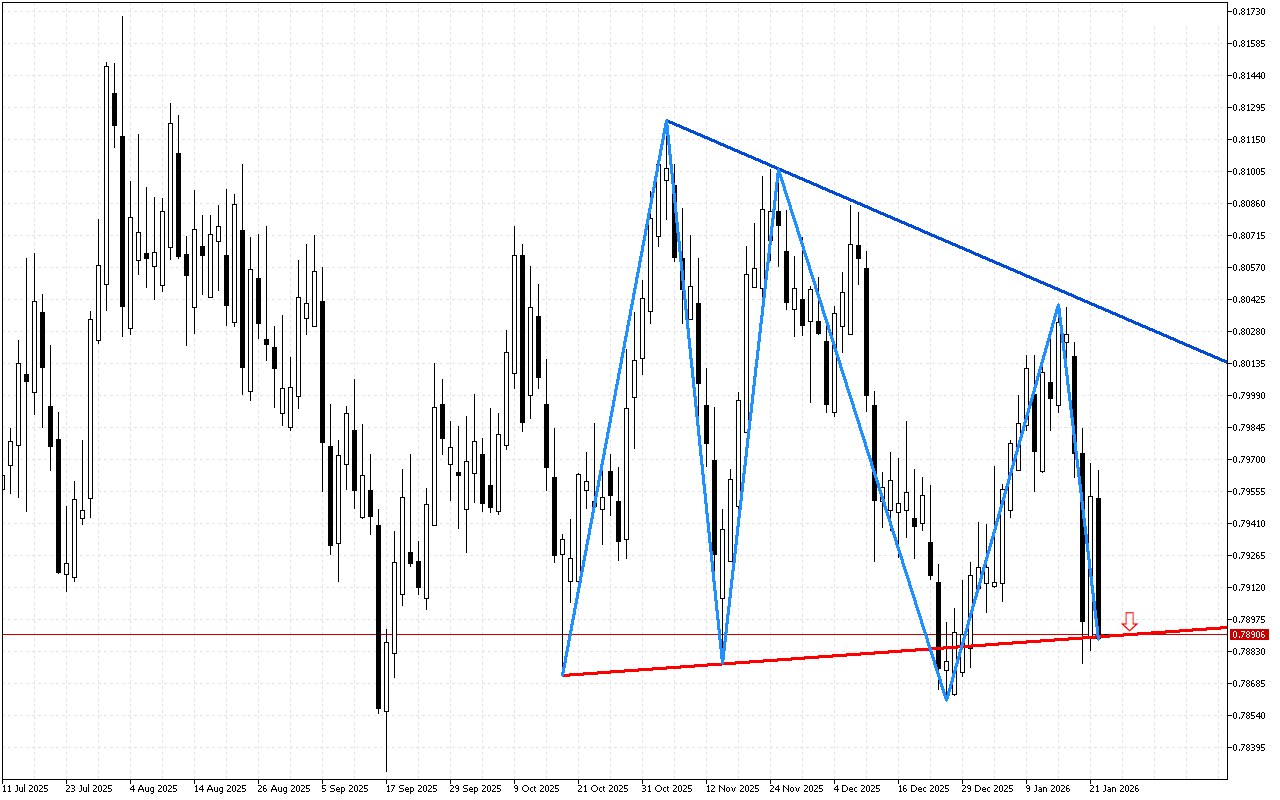
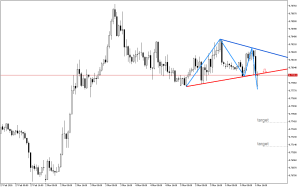
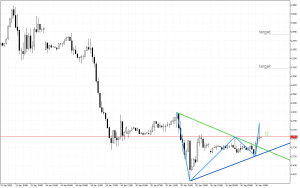
USDCHF D1: The descending triangle figure indicates a possible downward price move
The characteristics of the previous period indicate that traders could not decide on the direction of USDCHF, but then the pattern formed on the chart indicated a possible end to the period of uncertainty.
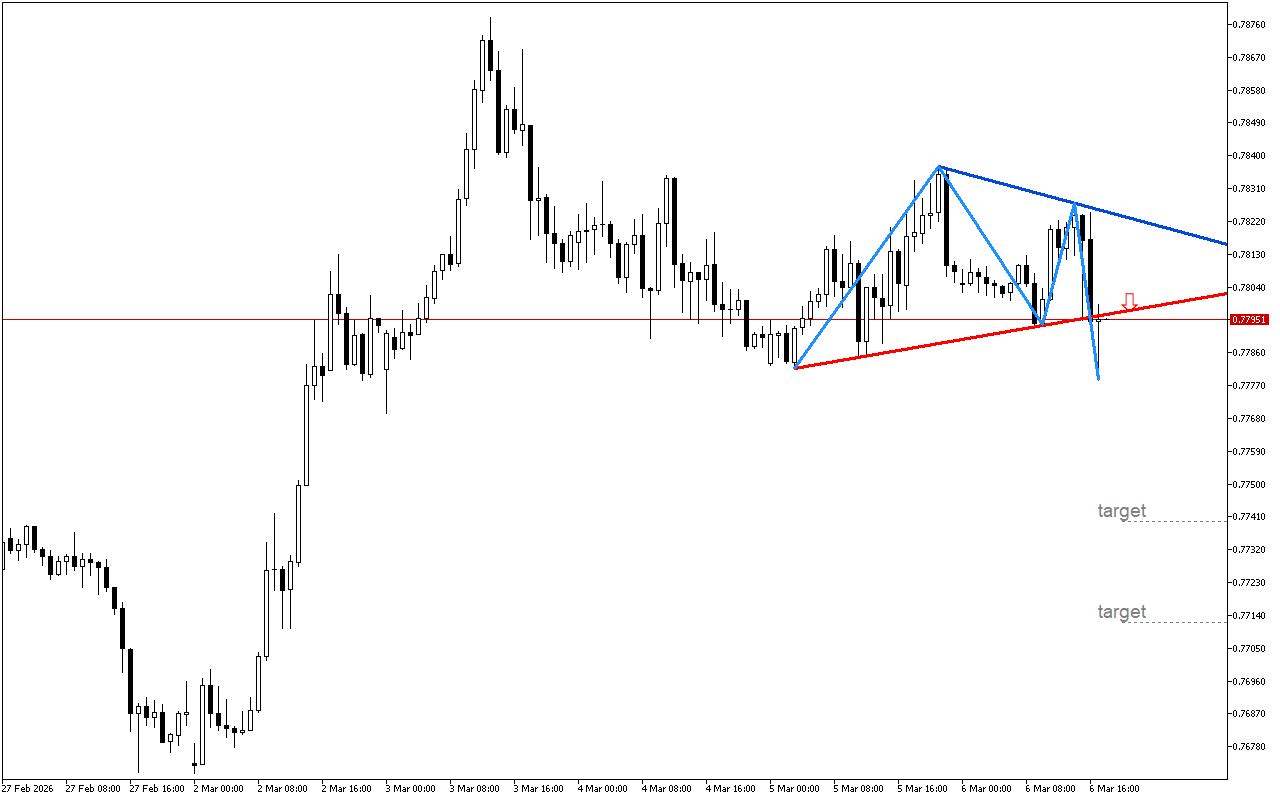
The price breaks through the horizontal support line of the descending triangle, which is a signal of continued downward movement. A breakdown may be accompanied by a surge in volatility. The price decline target can be a value equal to the height of the triangle, laid down from the breakout point.
Short positions in respect to USDCHF look more warranted strategically. More conservative traders may consider entering upon a retest of this level. With a more aggressive strategy, a trader can enter at or around the current prices.
📌 Entry: 0.78900
✔️ First target: 0.76375
✔️ Second target: 0.75118
❌ Stop order: 0.81237


Post Comment