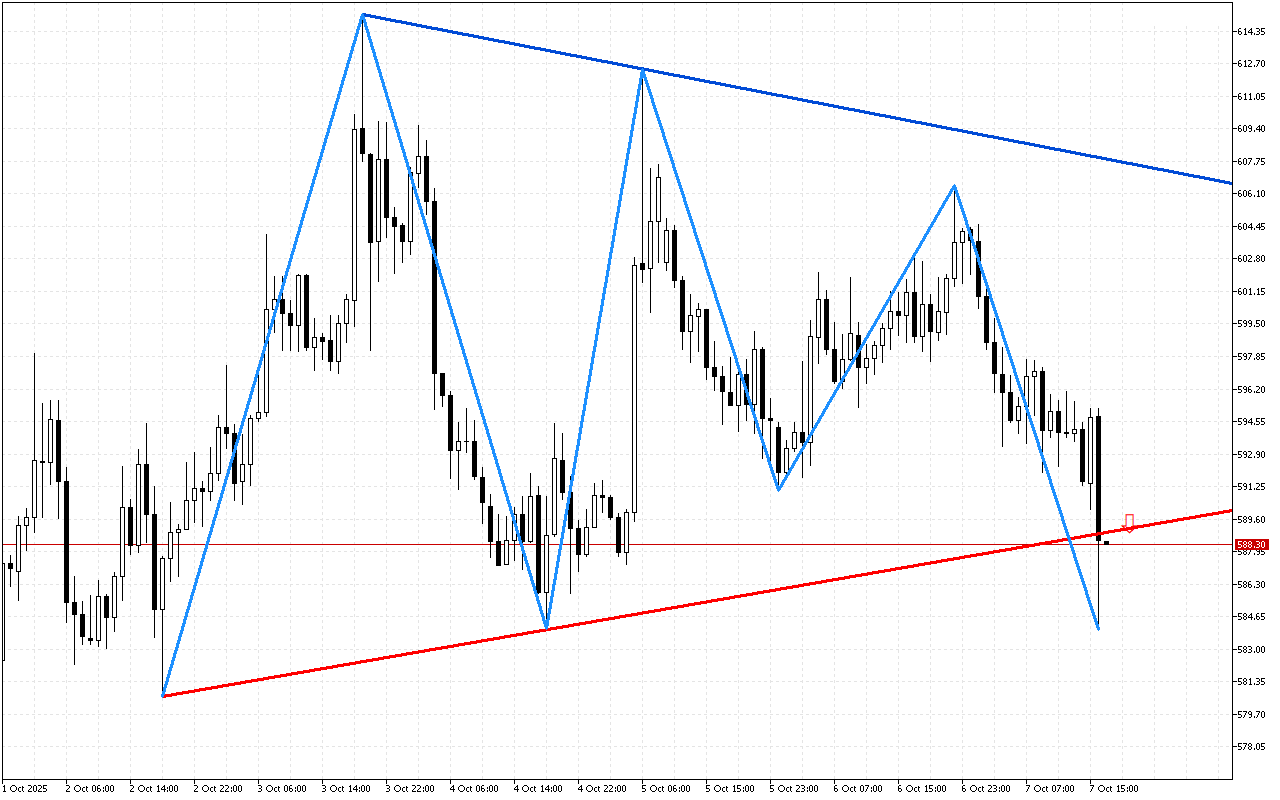
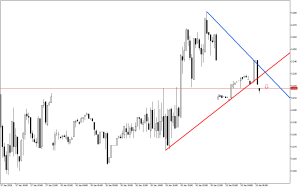
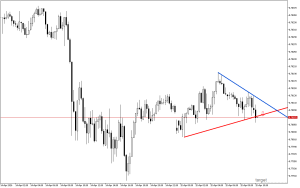
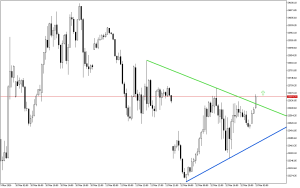
Bit.Cash H1: The price moved beyond the lower boundary of the triangle
The characteristics of the previous period indicate that traders could not decide on the direction of Bit.Cash, but then the pattern formed on the chart indicated a possible end to the period of uncertainty.
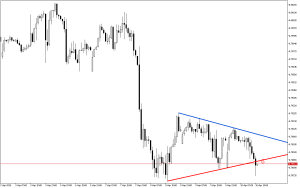
The formation of a symmetrical triangle on the chart indicates a phase of consolidation or uncertainty. A break through the lower leg of the triangle is a key signal of a potential downward movement.
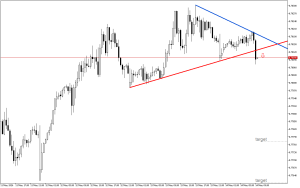
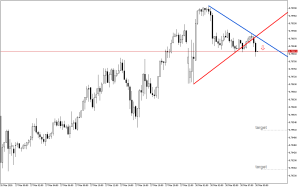
Short positions in respect to Bit.Cash look more warranted strategically. More conservative traders may consider entering upon a retest of this level. With a more aggressive strategy, a trader can enter at or around the current prices.
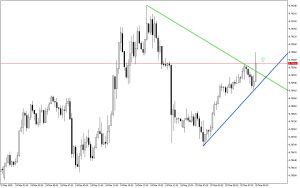
📌 Entry: 588.49
✔️ First target: 553.93
✔️ Second target: 536.64
❌ Stop order: 615.19

Post Comment