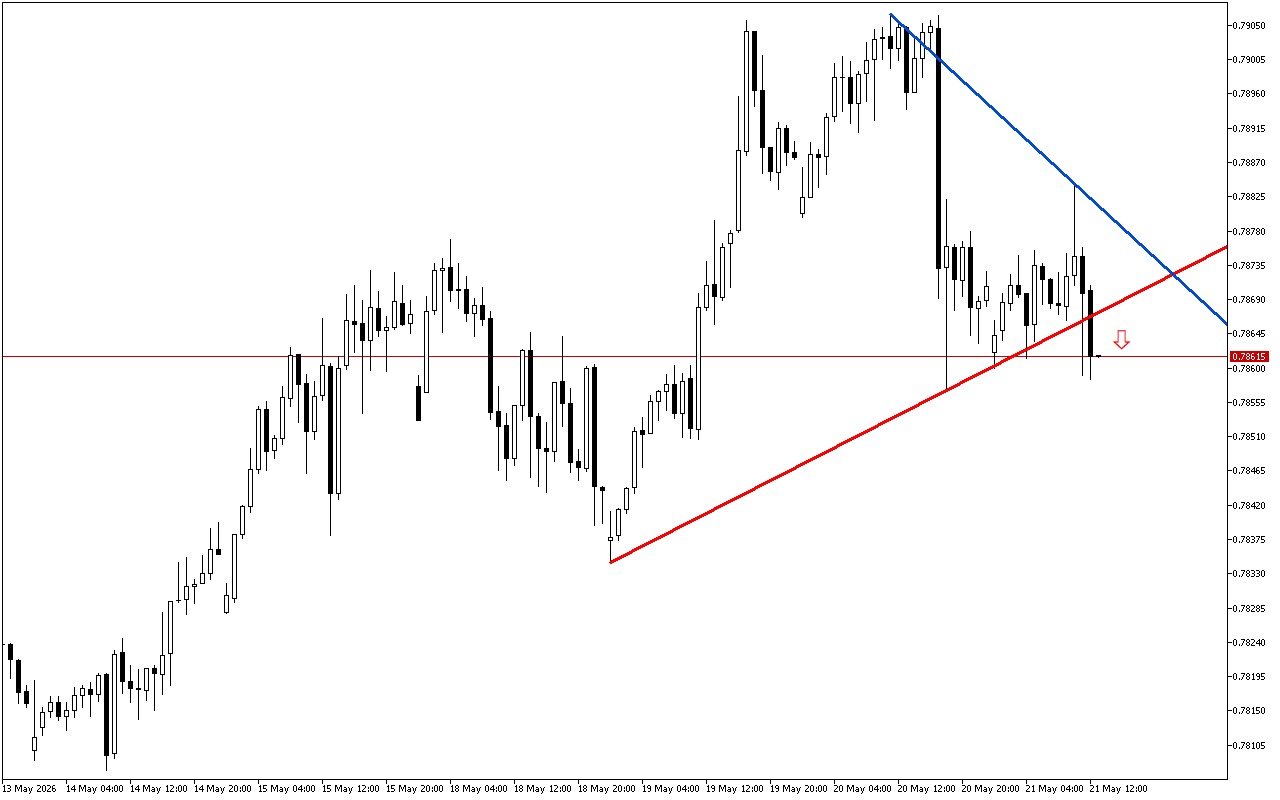
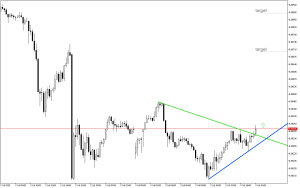
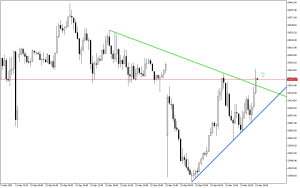
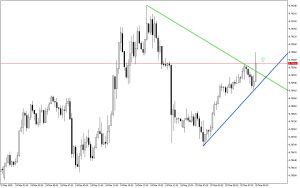
USDCHF H1: If the price leaves the triangle, it can trigger a downward impulse
The USDCHF pattern formed on the chart indicates a potential change of the price direction.
The formation of a symmetrical triangle on the chart indicates a phase of consolidation or uncertainty. A break through the lower leg of the triangle is a key signal of a potential downward movement.
At this time interval for USDCHF, trading recommendations suggest opening short positions.
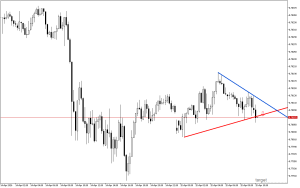
📌 Entry: 0.78617
✔️ First target: 0.77896
✔️ Second target: 0.77537
❌ Stop order: 0.79064

Post Comment