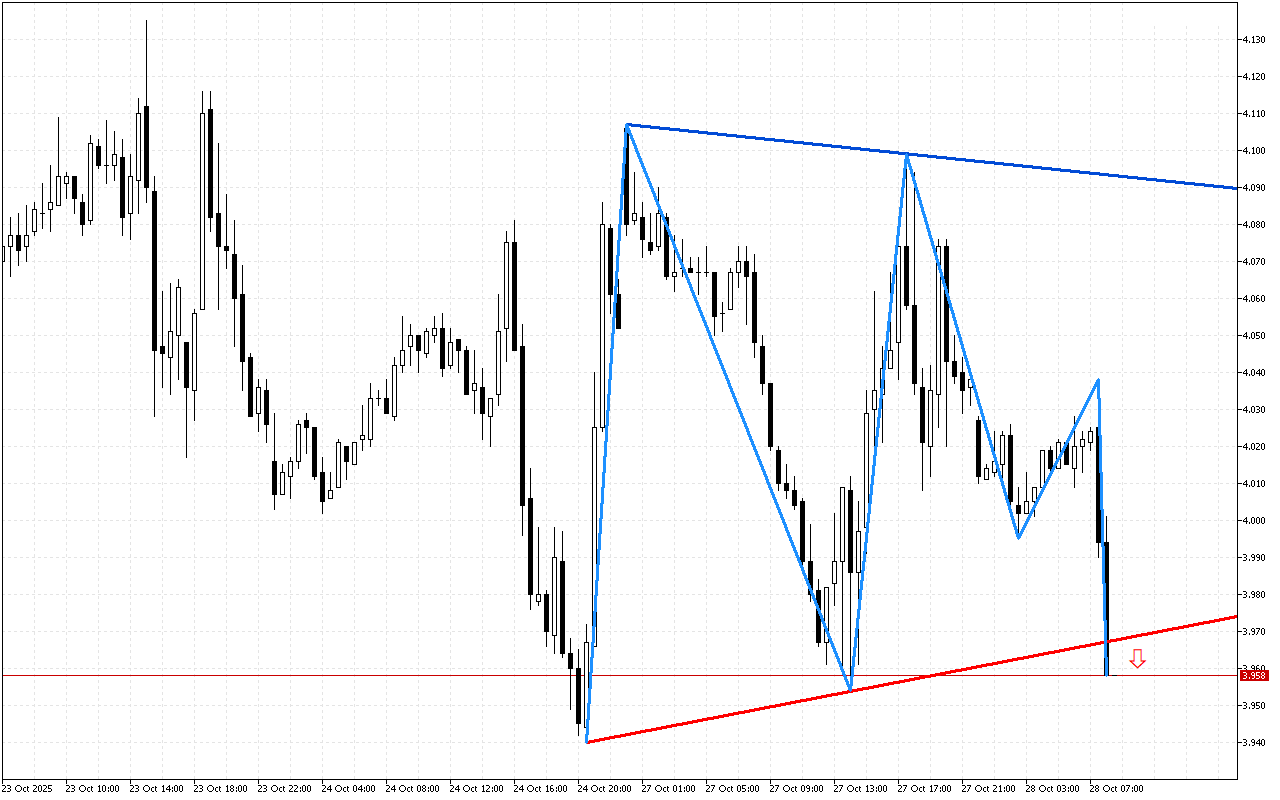
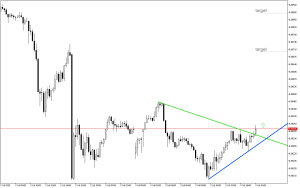
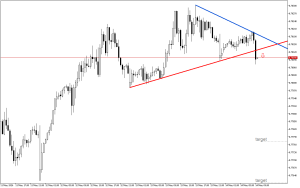
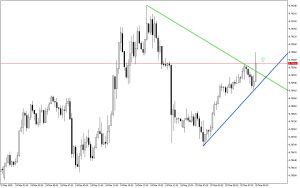
Natural Gas M30: A symmetrical triangle is formed
The formed pattern on the Natural Gas chart indicates a likely change of trend.
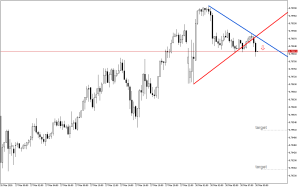
The formation of a symmetrical triangle on the chart indicates a phase of consolidation or uncertainty. A break through the lower leg of the triangle is a key signal of a potential downward movement.
When it comes to Natural Gas short positions now look more preferable. For aggressive trading, a trader can enter the market at the current prices. Advocates of a more conservative strategy should wait for the level to be retested.
📌 Entry: 3.958
✔️ First target: 3.791
✔️ Second target: 3.708
❌ Stop order: 4.107
Post Comment