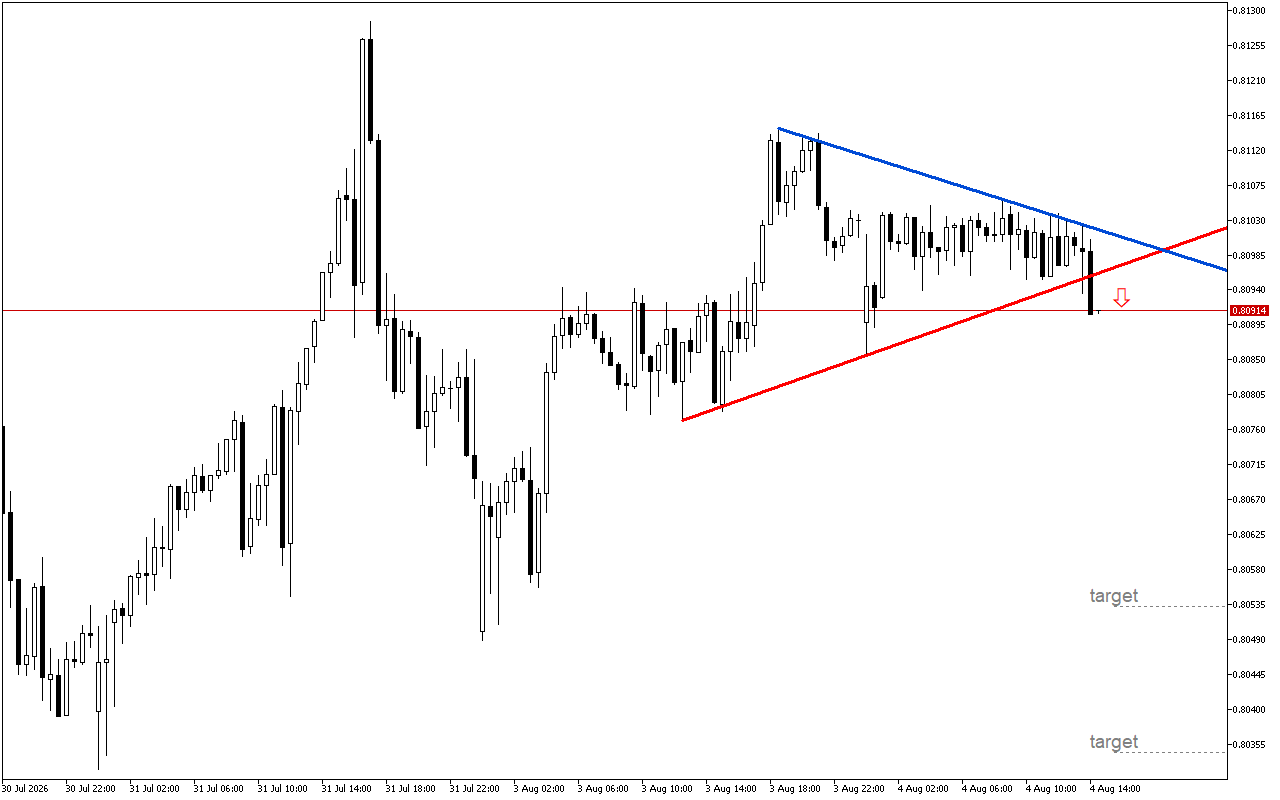
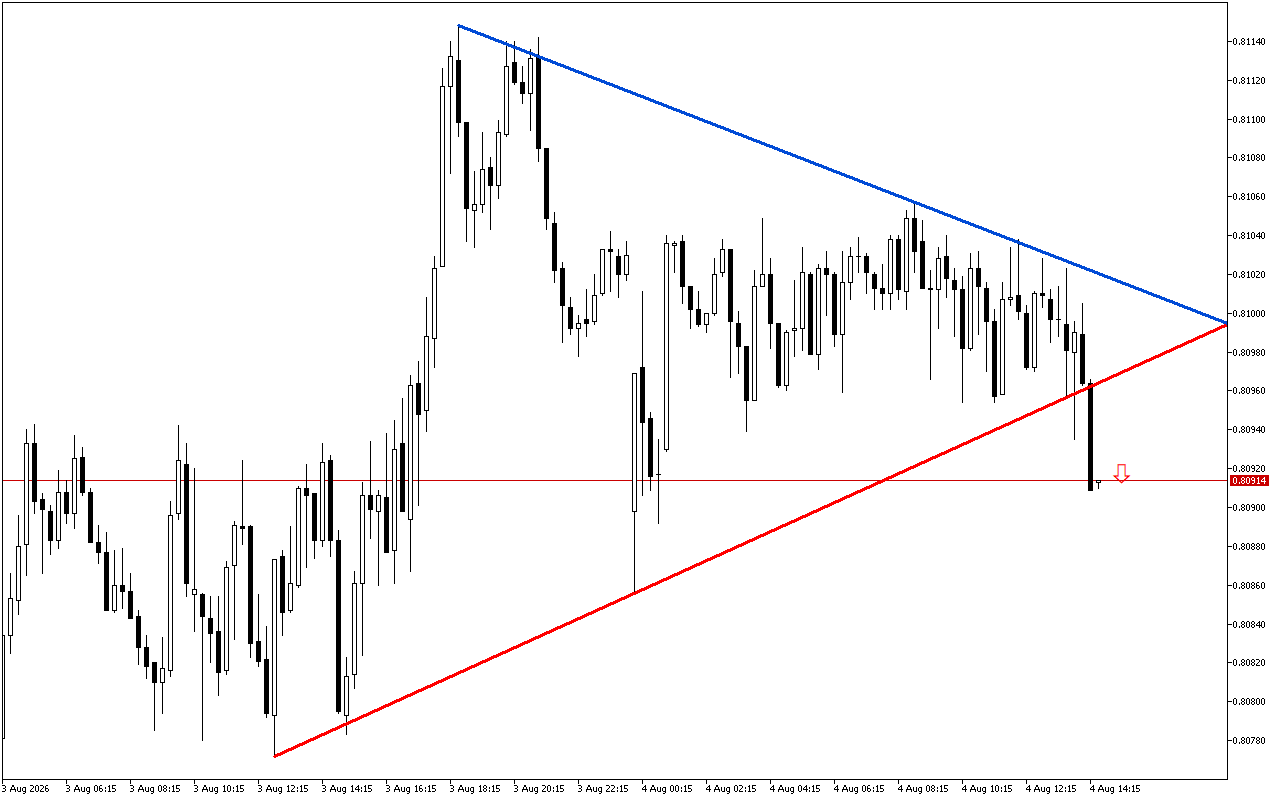
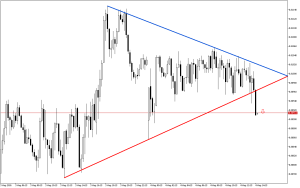
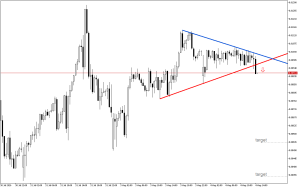
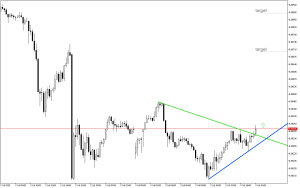
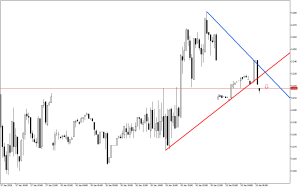
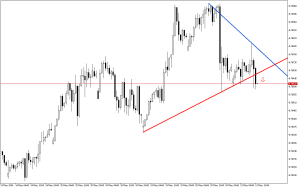
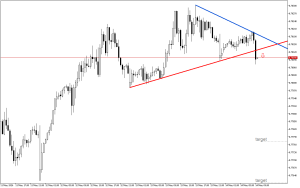
USDCHF M30: The lower boundary of the symmetrical triangle has been broken lower
The formed pattern on the USDCHF chart indicates a likely change of trend.
The formation of a symmetrical triangle on the chart indicates a phase of consolidation or uncertainty. A break through the lower leg of the triangle is a key signal of a potential downward movement.
It is recommended to focus on short positions on USDCHF. Entry points can be detected now or upon the technical confirmation after a retest of this level.
📌 Entry: 0.8091
✔️ First target: 0.8053
✔️ Second target: 0.8035
❌ Stop order: 0.8115
Post Comment