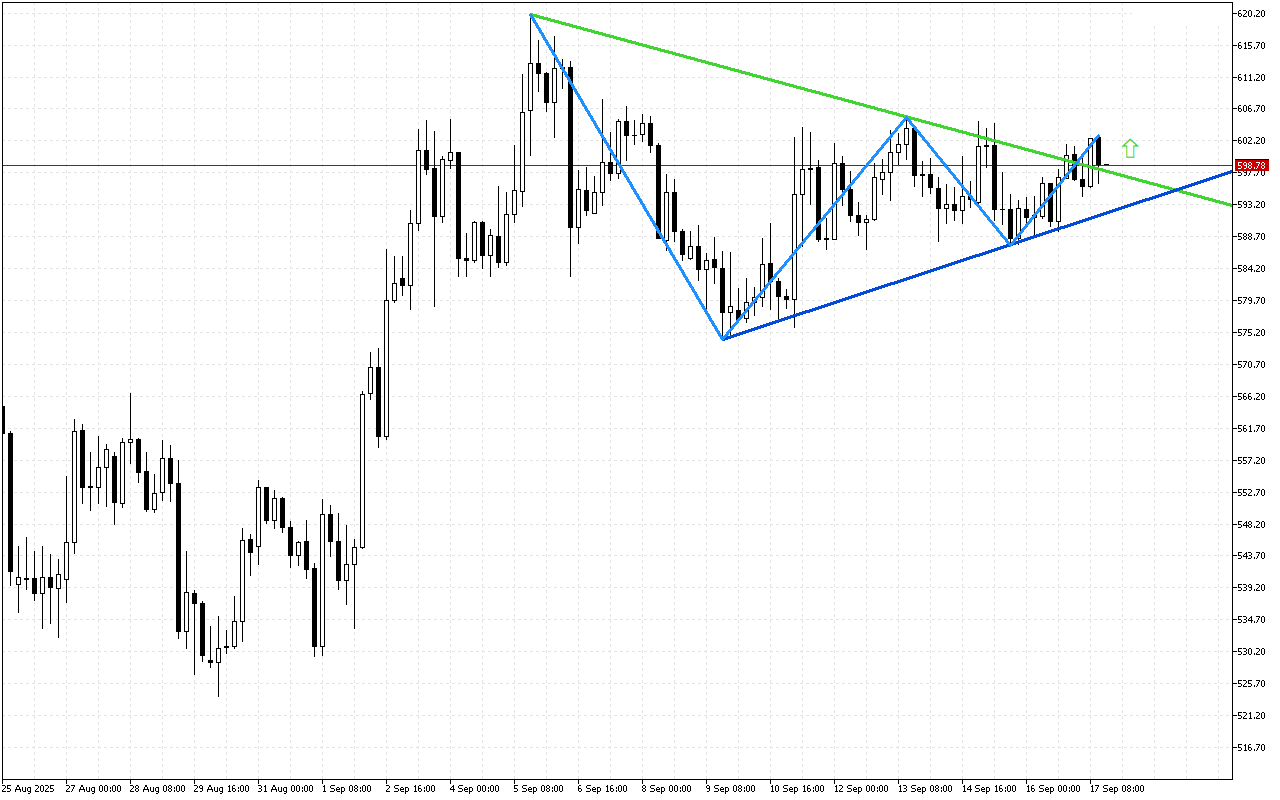
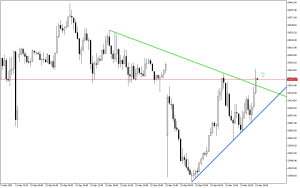
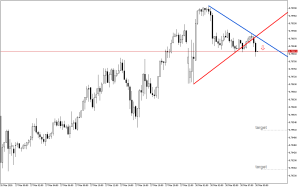
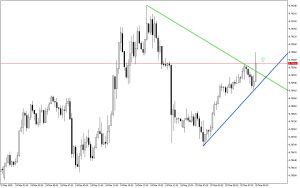
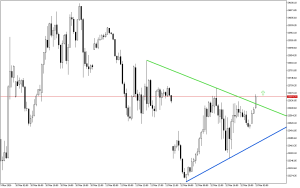
Bit.Cash H4: The formation of the “Symmetrical Triangle” pattern has completed
Analysis of the Bit.Cash chart shows that the price may exhibit growth.
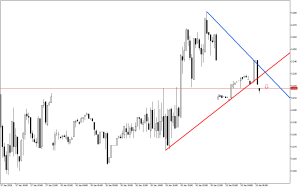
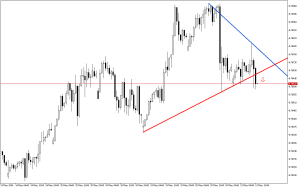
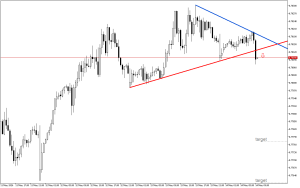
The formation of a symmetrical triangle on a chart often indicates a period of uncertainty and consolidation, when the strength of trading participants is approximately equal. However, when the price breaks the upper boundary of the triangle, it indicates that the price is more likely to continue moving higher thereafter.
Thus, based on Bit.Cash, it is recommended to focus on opening long positions. The market entry point is warranted at the current level or upon the retest of the support level.
📌 Entry: 598.80
✔️ First target: 644.63
✔️ Second target: 667.54
❌ Stop order: 574.14

Post Comment